


Fazit - Der neue Surface Laptop 13 ist einfach zu teuer
Für sich gesehen ist der neue Surface Laptop 13 ein leiser und ausreichend schneller Alltagsbegleiter mit langen Akkulaufzeiten. Der IPS-Touchscreen bietet zwar eine ordentliche Bildqualität, allerdings liegt die Frequenz auch nur bei 60 Hz.
Bei der Leistung reicht der kleinste Snapdragon X Plus zwar aus und er unterstützt als Copilot+-Laptop auch alle KI-Funktionen von Windows, doch vor allem die abgespeckte GPU ist sehr schwach und limitiert die ohnehin schon eingeschränkte Gaming-Leistung noch weiter. Von der Leistung des passiv gekühlten MacBook Air M4 kann der Surface Laptop aber nur träumen. Zumindest bleibt das Gerät fast immer lautlos, solange man den Prozessor nicht zu stark belastet.
Das große Problem ist aber der Surface Laptop 13.8, der zwar etwas kürzere Akkulaufzeiten bietet, dafür aber schon in der Basisversion den etwas schnelleren Snapdragon X Plus mit 10 Kernen, ein haptisches Trackpad und vor allem den deutlich besseren 120-Hz-Bildschirm bietet. Gleichzeitig ist der Preis des Surface Laptop 13.8 im Handel entweder vergleichbar oder im Angebot teilweise schon 100-150 Euro günstiger und beinhaltet zudem ein Netzteil, dass sich der Hersteller beim neuen Surface Laptop 13 einfach spart.
Wenn man den neuen Surface Laptop 13 als Nachfolger für den Surface Laptop Go 3 sieht, dann ist das neue Modell etwas größer, aber in praktisch jeder Hinsicht besser. Allerdings macht es bei dem aktuellen Preisgefüge einfach keinen Sinn, nicht den deutlich besseren Surface Laptop 13.8 zu nehmen.
Pro
Contra
Preis und Verfügbarkeit
Der Surface Laptop 13 wird am 10. Juni erscheinen und kann bei Amazon für 1.099 Euro in deer Basisvariante vorbestellt werden. Unsere Testkonfiguration mit der größeren 512-GB-SSD ist für 1.219 Euro verfügbar.
Microsoft erweitert sein Surface-Laptop-Lineup mit einen neuem 13-Zoll-Modell, also nur minimal kleiner als das bekannte 13,8-Zoll-Modell. Bei der Ausstattung gibt es mit dem kleinen Snapdragon X Plus, 16 GB RAM und einem Full-HD-Touchscreen mit 60 Hz allerdings keine Highlights. Der Startpreis mit 256 GB SSD-Speicher liegt bei 1.099 Euro; wir testen die Variante mit 512 GB SSD-Speicher für 1.219 Euro.
Spezifikationen
Gehäuse & Ausstattung
Der neue Surface Laptop unterscheidet sich beim Design ein wenig von den größeren Modellen, da die Baseunit etwas mehr abgerundet ist. Mit 1,2 kg ist das Gerät zwar nicht besonders schwer, aber gerade im hinteren Bereich (15,9 mm) fühlt es sich etwas wuchtig an. Die Verarbeitung ist sehr gut und auch bei der Stabilität enttäuscht das Metallgehäuse nicht. Beim Öffnen des Deckels (max. ~135 Grad) kommt es aber zu Knarzgeräuschen und mit einer Hand ist das auch kaum möglich. Unter den vier gesteckten Gummifüßen verbergen sich Schrauben, doch selbst nach dem Entfernen war die untere Abdeckung bei unserem Testgerät extrem fest und wir konnten die Abdeckung nicht entfernen (Update: Siehe Kapitel Wartung). Das Gehäuse ist in Silber, Violett oder Ozean (wie beim Testgerät) verfügbar.
Bei den Anschlüssen streicht Microsoft den Surface-Connector, was problematisch sein kann, wenn man noch entsprechendes Zubehör hat. Die beiden USB-C-Anschlüsse unterstützen nur den 3.2-Standard. Es gibt aber Wi-Fi 7 und die Transferraten waren in unserem Test sehr gut. Die 1080p-Webcam macht vernünftige Bilder und es handelt sich um einen Copilot+-Laptop.


| Networking | |
| Microsoft Surface Laptop 13 | |
| iperf3 transmit AXE11000 | |
| iperf3 receive AXE11000 | |
| Microsoft Surface Laptop 7 13.8 Copilot+ | |
| iperf3 transmit AXE11000 | |
| iperf3 receive AXE11000 | |
| iperf3 transmit AXE11000 6GHz | |
| iperf3 receive AXE11000 6GHz | |
| Apple MacBook Air 13 M3 10C GPU | |
| iperf3 transmit AXE11000 | |
| iperf3 receive AXE11000 | |
| Dell XPS 13 9345 | |
| iperf3 transmit AXE11000 | |
| iperf3 receive AXE11000 | |
| iperf3 transmit AXE11000 6GHz | |
| iperf3 receive AXE11000 6GHz | |
| Framework Laptop 13.5 Core Ultra 7 155H | |
| iperf3 transmit AXE11000 | |
| iperf3 receive AXE11000 | |
| iperf3 transmit AXE11000 6GHz | |
| iperf3 receive AXE11000 6GHz | |
| Microsoft Surface Laptop Go 3 | |
| iperf3 transmit AXE11000 | |
| iperf3 receive AXE11000 | |


Update: Wartung
Mit den offiziellen Reparaturanweisungen von Microsoft haben wir noch einmal versucht, das Gehäuse zu öffnen und waren im Endeffekt auf erfolgreich. Nach dem Entfernen der Schrauben muss man mit mehreren Spudgern versuchen, die Oberseite der Baseunit anzuheben. Diese kann dann nach vorne geklappt oder nach dem Entfernen eines Datenkabels auch komplett abgehoben werden. Nun können wir auch einen Blick auf die Kühlung sowie den austauschbaren UFS-Speicher werfen, wobei hier noch zusätzliches Klebeband zum Einsatz kommt. Nachdem Microsoft die Wartungsmöglichkeiten bzw. den Zugang zu den Komponenten bei den anderen Surface-Laptop-Modellen verbessert hatte, ist das nun wieder ein ganz klarer Rückschritt.


Nachhaltigkeit
Der Surface Laptop 13 erfüllt die Energy-Star-Zertifizierung und Microsoft gibt auf seiner Webseite an, bei welchen Bauteilen recyclete Materialien verwendet wurden. Im Gegensatz zum Surface Laptop 13.8 werden aber keine Angaben zum Gehäuse selbst gemacht. Die Verpackung kann vollständig recyclet werden.
Eingabegeräte - Beleuchtete Tastatur
Die beleuchtete Tastatur bietet ein komfortables Tippgefühl und im Power-Button oben rechts ist ein Fingerabdruckscanner integriert. Im Gegensatz zum Surface Laptop 13.8 ist kein haptisches Trackpad verbaut, das reguläre Clickpad macht seine Sache aber gut und überzeugt mit guten Gleiteigenschaften sowie leisen mechanischen Klicks.


Zusätzlich hat uns Microsoft noch ein Exempla der neuen Surface Arc Maus geschickt, die man für den Transport flach machen kann. Der Betrieb funktioniert allerdings nur im gebogenen Zustand und hier gibt es nur eine Position. Bei der Ergonomie kann die Maus aber nicht überzeugen, denn aufgrund des dünnen Designs hängen vor allem der Ringfinger sowie der kleine Finger immer in der Luft. Die mechanische Taste ist ein kleines ClickPad, auf dem man auch scrollen kann. Das funktioniert auch, ist aber etwas umständlich und insgesamt können wir die Surface Arc Maus nicht empfehlen.
Display - IPS mit 60 Hz

Der 13 Zoll große IPS-Bildschirm bietet die Auflösung 1.920 x 1.280 Pixel (3:2) und bietet eine gute subjektive Bildqualität, wobei auch helle Flächen nicht körnig wirken. Die Farben sind kräftig(sRGB) und die Inhalte noch ausreichend scharf, allerdings liegt die Frequenz nur bei 60 Hz. PWM-Flackern ist nicht vorhanden und die Reaktionszeiten sind nicht besonders schnell, im Alltag aber unauffällig. Sowohl die Helligkeit als auch die Farbtemperatur können via Sensor geregelt werden. Im Freien ist die Nutzung aufgrund der starken Reflexionen problematisch.
Die Helligkeit liegt bei etwas mehr als 400 cd/m2 und zusammen mit dem geringen Schwarzwert (0,17) ergibt sich ein sehr hohes maximales Kontrastverhältnis. Es gibt zwei vorinstallierte Farbprofile, die wir mit der professionellen CalMAN-Software vermessen haben. Das Enhanced-Profil zeigt die Farben etwas übersättigt an, das sRGB-Profil ist aber sehr genau und hier ist auch die Bildbearbeitung problemlos möglich. Dennoch ist der Bildschirm des Surface Laptop 13.8 (heller, 120 Hz, P3) klar besser.
| |||||||||||||||||||||||||
Ausleuchtung: 92 %
Helligkeit Akku: 417 cd/m²
Kontrast: 2453:1 (Schwarzwert: 0.17 cd/m²)
ΔE Color 1.3 | 0.5-29.43 Ø4.84
ΔE Greyscale 2 | 0.09-98 Ø5.1
72.6% AdobeRGB 1998 (Argyll 2.2.0 3D)
97.6% sRGB (Argyll 2.2.0 3D)
72.4% Display P3 (Argyll 2.2.0 3D)
Gamma: 2.18
| Microsoft Surface Laptop 13 LP130WU112413, IPS, 1920x1280, 13", 60 Hz | Microsoft Surface Laptop 7 13.8 Copilot+ LQ138P1JX61, IPS, 2304x1536, 13.8", 120 Hz | Apple MacBook Air 13 M4 Entry IPS, 2560x1664, 13.6", 60 Hz | Apple MacBook Air 13 M3 10C GPU IPS, 2560x1664, 13.6", 60 Hz | Dell XPS 13 9345 IPS, 1920x1200, 13.4", 120 Hz | Framework Laptop 13.5 Core Ultra 7 155H BOE NE135A1M-NY1, IPS, 2880x1920, 13.5", 120 Hz | Microsoft Surface Laptop Go 3 LP125WX172403, IPS, 1536x1024, 12.4", 60 Hz | |
|---|---|---|---|---|---|---|---|
| Display | 19% | 20% | 20% | -2% | 1% | -7% | |
| Display P3 Coverage | 72.4 | 97.8 35% | 98.4 36% | 98.4 36% | 69.4 -4% | 72.8 1% | 64.5 -11% |
| sRGB Coverage | 97.6 | 98.2 1% | 99.9 2% | 99.9 2% | 97.8 0% | 98.6 1% | 96.9 -1% |
| AdobeRGB 1998 Coverage | 72.6 | 87.3 20% | 87.9 21% | 87.9 21% | 71.7 -1% | 72.9 0% | 66.6 -8% |
| Response Times | 26% | 11% | 11% | 21% | 10% | 9% | |
| Response Time Grey 50% / Grey 80% * | 48.7 ? | 38.9 ? 20% | 34.5 ? 29% | 34.5 ? 29% | 35.2 ? 28% | 41.9 ? 14% | 36.7 ? 25% |
| Response Time Black / White * | 25.3 ? | 17.4 ? 31% | 27.2 ? -8% | 27.2 ? -8% | 21.8 ? 14% | 23.7 ? 6% | 27.1 ? -7% |
| PWM Frequency | 60000 ? | ||||||
| Bildschirm | -10% | -19% | -19% | -51% | -80% | -15% | |
| Helligkeit Bildmitte | 417 | 606 45% | 525 26% | 525 26% | 518.3 24% | 498.5 20% | 339 -19% |
| Brightness | 409 | 592 45% | 506 24% | 506 24% | 487 19% | 464 13% | 337 -18% |
| Brightness Distribution | 92 | 94 2% | 92 0% | 92 0% | 86 -7% | 86 -7% | 96 4% |
| Schwarzwert * | 0.17 | 0.43 -153% | 0.42 -147% | 0.42 -147% | 0.26 -53% | 0.36 -112% | 0.34 -100% |
| Kontrast | 2453 | 1409 -43% | 1250 -49% | 1250 -49% | 1993 -19% | 1385 -44% | 997 -59% |
| Delta E Colorchecker * | 1.3 | 1.3 -0% | 1.4 -8% | 1.4 -8% | 3.4 -162% | 4.27 -228% | 0.9 31% |
| Colorchecker dE 2000 max. * | 2.9 | 2.1 28% | 2.8 3% | 2.8 3% | 5.68 -96% | 7.08 -144% | 2.4 17% |
| Delta E Graustufen * | 2 | 2.1 -5% | 2 -0% | 2 -0% | 4.2 -110% | 4.7 -135% | 1.5 25% |
| Gamma | 2.18 101% | 2.16 102% | 2.2 100% | 2.2 100% | 2.29 96% | 2.09 105% | 2.23 99% |
| CCT | 6890 94% | 6842 95% | 6876 95% | 6876 95% | 7235 90% | 7417 88% | 6523 100% |
| Colorchecker dE 2000 calibrated * | 1.26 | ||||||
| Durchschnitt gesamt (Programm / Settings) | 12% /
2% | 4% /
-5% | 4% /
-5% | -11% /
-28% | -23% /
-47% | -4% /
-9% |
* ... kleinere Werte sind besser


Reaktionszeiten (Response Times) des Displays
| ↔ Reaktionszeiten Schwarz zu Weiß | ||
|---|---|---|
| 25.3 ms ... steigend ↗ und fallend ↘ kombiniert | ↗ 12.4 ms steigend |  |
| ↘ 12.9 ms fallend | ||
| Die gemessenen Reaktionszeiten sind mittelmäßig und dadurch für Spieler eventuell zu langsam. Im Vergleich rangierten die bei uns getesteten Geräte von 0.1 (Minimum) zu 240 (Maximum) ms. » 59 % aller Screens waren schneller als der getestete. Daher sind die gemessenen Reaktionszeiten schlechter als der Durchschnitt aller vermessenen Geräte (20.5 ms). | ||
| ↔ Reaktionszeiten 50% Grau zu 80% Grau | ||
| 48.7 ms ... steigend ↗ und fallend ↘ kombiniert | ↗ 22.5 ms steigend | 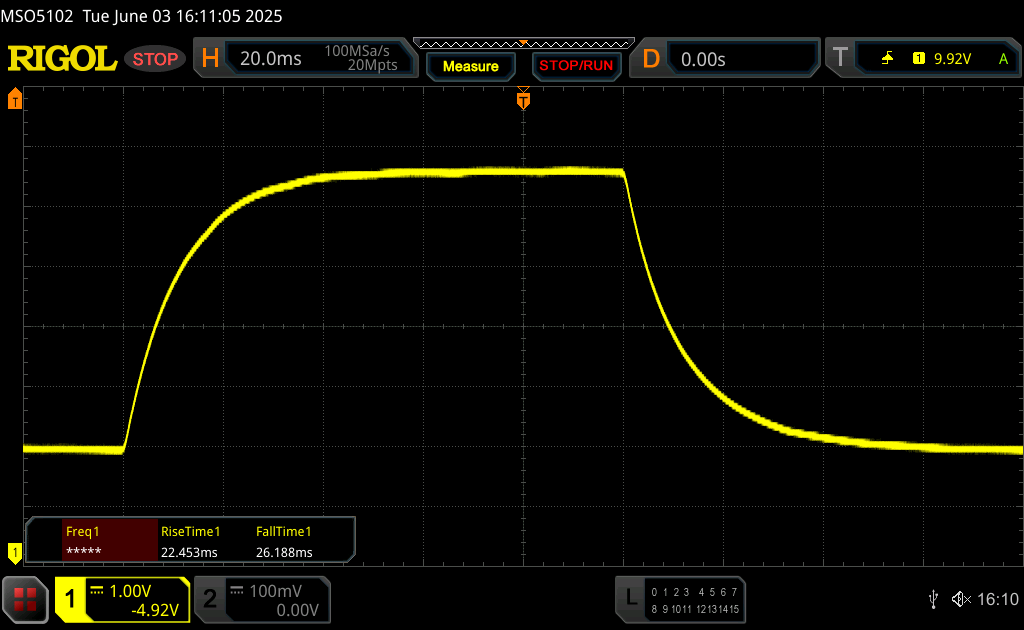 |
| ↘ 26.2 ms fallend | ||
| Die gemessenen Reaktionszeiten sind langsam und dadurch für viele Spieler wahrscheinlich zu langsam. Im Vergleich rangierten die bei uns getesteten Geräte von 0.165 (Minimum) zu 636 (Maximum) ms. » 83 % aller Screens waren schneller als der getestete. Daher sind die gemessenen Reaktionszeiten schlechter als der Durchschnitt aller vermessenen Geräte (32.1 ms). | ||
Bildschirm-Flackern / PWM (Pulse-Width Modulation)
| Flackern / PWM nicht festgestellt |  | ||
Im Vergleich: 53 % aller getesteten Geräte nutzten kein PWM um die Helligkeit zu reduzieren. Wenn PWM eingesetzt wurde, dann bei einer Frequenz von durchschnittlich 8363 (Minimum 5, Maximum 343500) Hz. | |||


Leistung - Snapdragon X Plus & 16 GB RAM
Der Surface Laptop 13 ist ausschließlich mit dem kleinsten Snapdragon-X-Plus-Prozessor (X1P-42-100) sowie 16 GB RAM verfügbar.


Prozessor - Snapdragon X1P-42-100
Der Snapdragon X1P-42-100 bietet 8 Kerne mit bis zu 3,4 GHz und basierend auf unseren Energiemessungen darf dieser kurzzeitig bis zu 45 Watt und dauerhaft dann 35 Watt verbrauchen. Die beiden Benchmarks Cinebench 2024 sowie Geekbench 6.4 laufen nativ, doch der Surface Laptop ist stets auf dem letzten Platz. In den emulierten Tests muss er sich sogar dem alten Surface Laptop Go 3 geschlagen geben. Für einfache Alltagsaufgaben reicht die Leistung, die auch im Akkubetrieb stabil bleibt, aber aus.
Cinebench 2024: CPU Multi Core | CPU Single Core
Geekbench 6.4: Multi-Core | Single-Core
| CPU Performance Rating | |
| Apple MacBook Air 13 M4 Entry | |
| Dell XPS 13 9345 | |
| Microsoft Surface Laptop 7 13.8 Copilot+ | |
| Apple MacBook Air 13 M3 10C GPU | |
| Durchschnitt der Klasse Subnotebook | |
| Framework Laptop 13.5 Core Ultra 7 155H | |
| Microsoft Surface Laptop 13 | |
| Durchschnittliche Qualcomm Snapdragon X Plus X1P-42-100 | |
| Cinebench 2024 / CPU Multi Core | |
| Dell XPS 13 9345 | |
| Microsoft Surface Laptop 7 13.8 Copilot+ | |
| Apple MacBook Air 13 M4 Entry | |
| Microsoft Surface Laptop 13 | |
| Durchschnitt der Klasse Subnotebook (148 - 1162, n=65, der letzten 2 Jahre) | |
| Framework Laptop 13.5 Core Ultra 7 155H | |
| Durchschnittliche Qualcomm Snapdragon X Plus X1P-42-100 (554 - 759, n=8) | |
| Apple MacBook Air 13 M3 10C GPU | |
| Cinebench 2024 / CPU Single Core | |
| Apple MacBook Air 13 M4 Entry | |
| Apple MacBook Air 13 M3 10C GPU | |
| Microsoft Surface Laptop 7 13.8 Copilot+ | |
| Dell XPS 13 9345 | |
| Durchschnitt der Klasse Subnotebook (35 - 173, n=48, der letzten 2 Jahre) | |
| Microsoft Surface Laptop 13 | |
| Durchschnittliche Qualcomm Snapdragon X Plus X1P-42-100 (107 - 109, n=7) | |
| Framework Laptop 13.5 Core Ultra 7 155H | |
| Geekbench 6.4 / Multi-Core | |
| Apple MacBook Air 13 M4 Entry | |
| Dell XPS 13 9345 | |
| Microsoft Surface Laptop 7 13.8 Copilot+ | |
| Apple MacBook Air 13 M3 10C GPU | |
| Framework Laptop 13.5 Core Ultra 7 155H | |
| Durchschnitt der Klasse Subnotebook (2244 - 17489, n=77, der letzten 2 Jahre) | |
| Durchschnittliche Qualcomm Snapdragon X Plus X1P-42-100 (10833 - 11508, n=7) | |
| Microsoft Surface Laptop 13 | |
| Geekbench 6.4 / Single-Core | |
| Apple MacBook Air 13 M4 Entry | |
| Apple MacBook Air 13 M3 10C GPU | |
| Dell XPS 13 9345 | |
| Microsoft Surface Laptop 7 13.8 Copilot+ | |
| Durchschnitt der Klasse Subnotebook (960 - 3820, n=72, der letzten 2 Jahre) | |
| Framework Laptop 13.5 Core Ultra 7 155H | |
| Durchschnittliche Qualcomm Snapdragon X Plus X1P-42-100 (2287 - 2442, n=6) | |
| Microsoft Surface Laptop 13 | |
Cinebench R15 Multi Dauertest
Cinebench R23: Multi Core | Single Core
Cinebench R20: CPU (Multi Core) | CPU (Single Core)
Cinebench R15: CPU Multi 64Bit | CPU Single 64Bit
Blender: v2.79 BMW27 CPU
7-Zip 18.03: 7z b 4 | 7z b 4 -mmt1
HWBOT x265 Benchmark v2.2: 4k Preset
LibreOffice : 20 Documents To PDF
R Benchmark 2.5: Overall mean
| CPU Performance Rating | |
| Framework Laptop 13.5 Core Ultra 7 155H | |
| Durchschnitt der Klasse Subnotebook | |
| Microsoft Surface Laptop 7 13.8 Copilot+ | |
| Dell XPS 13 9345 | |
| Apple MacBook Air 13 M3 10C GPU -9! | |
| Microsoft Surface Laptop Go 3 | |
| Durchschnittliche Qualcomm Snapdragon X Plus X1P-42-100 | |
| Microsoft Surface Laptop 13 | |
| Cinebench R23 / Multi Core | |
| Framework Laptop 13.5 Core Ultra 7 155H | |
| Durchschnitt der Klasse Subnotebook (1555 - 21812, n=75, der letzten 2 Jahre) | |
| Apple MacBook Air 13 M3 10C GPU | |
| Microsoft Surface Laptop 7 13.8 Copilot+ | |
| Dell XPS 13 9345 | |
| Microsoft Surface Laptop 13 | |
| Durchschnittliche Qualcomm Snapdragon X Plus X1P-42-100 (6062 - 8284, n=7) | |
| Microsoft Surface Laptop Go 3 | |
| Cinebench R23 / Single Core | |
| Apple MacBook Air 13 M3 10C GPU | |
| Framework Laptop 13.5 Core Ultra 7 155H | |
| Durchschnitt der Klasse Subnotebook (358 - 2165, n=75, der letzten 2 Jahre) | |
| Microsoft Surface Laptop Go 3 | |
| Microsoft Surface Laptop 7 13.8 Copilot+ | |
| Dell XPS 13 9345 | |
| Durchschnittliche Qualcomm Snapdragon X Plus X1P-42-100 (1065 - 1134, n=7) | |
| Microsoft Surface Laptop 13 | |
| Cinebench R20 / CPU (Multi Core) | |
| Framework Laptop 13.5 Core Ultra 7 155H | |
| Durchschnitt der Klasse Subnotebook (579 - 8541, n=70, der letzten 2 Jahre) | |
| Microsoft Surface Laptop 7 13.8 Copilot+ | |
| Dell XPS 13 9345 | |
| Microsoft Surface Laptop 13 | |
| Durchschnittliche Qualcomm Snapdragon X Plus X1P-42-100 (2361 - 3097, n=7) | |
| Microsoft Surface Laptop Go 3 | |
| Cinebench R20 / CPU (Single Core) | |
| Framework Laptop 13.5 Core Ultra 7 155H | |
| Durchschnitt der Klasse Subnotebook (128 - 826, n=70, der letzten 2 Jahre) | |
| Microsoft Surface Laptop Go 3 | |
| Microsoft Surface Laptop 7 13.8 Copilot+ | |
| Dell XPS 13 9345 | |
| Microsoft Surface Laptop 13 | |
| Durchschnittliche Qualcomm Snapdragon X Plus X1P-42-100 (406 - 425, n=7) | |
| Cinebench R15 / CPU Multi 64Bit | |
| Framework Laptop 13.5 Core Ultra 7 155H | |
| Microsoft Surface Laptop 7 13.8 Copilot+ | |
| Durchschnitt der Klasse Subnotebook (327 - 3345, n=75, der letzten 2 Jahre) | |
| Dell XPS 13 9345 | |
| Durchschnittliche Qualcomm Snapdragon X Plus X1P-42-100 (1191 - 1556, n=7) | |
| Microsoft Surface Laptop 13 | |
| Microsoft Surface Laptop Go 3 | |
| Cinebench R15 / CPU Single 64Bit | |
| Framework Laptop 13.5 Core Ultra 7 155H | |
| Durchschnitt der Klasse Subnotebook (72.4 - 322, n=71, der letzten 2 Jahre) | |
| Microsoft Surface Laptop 7 13.8 Copilot+ | |
| Dell XPS 13 9345 | |
| Microsoft Surface Laptop Go 3 | |
| Microsoft Surface Laptop 13 | |
| Durchschnittliche Qualcomm Snapdragon X Plus X1P-42-100 (206 - 215, n=7) | |
| Blender / v2.79 BMW27 CPU | |
| Microsoft Surface Laptop Go 3 | |
| Apple MacBook Air 13 M3 10C GPU | |
| Durchschnittliche Qualcomm Snapdragon X Plus X1P-42-100 (399 - 683, n=7) | |
| Microsoft Surface Laptop 13 | |
| Durchschnitt der Klasse Subnotebook (159 - 2271, n=72, der letzten 2 Jahre) | |
| Dell XPS 13 9345 | |
| Microsoft Surface Laptop 7 13.8 Copilot+ | |
| Framework Laptop 13.5 Core Ultra 7 155H | |
| 7-Zip 18.03 / 7z b 4 | |
| Framework Laptop 13.5 Core Ultra 7 155H | |
| Durchschnitt der Klasse Subnotebook (11668 - 77867, n=67, der letzten 2 Jahre) | |
| Microsoft Surface Laptop 7 13.8 Copilot+ | |
| Dell XPS 13 9345 | |
| Microsoft Surface Laptop 13 | |
| Durchschnittliche Qualcomm Snapdragon X Plus X1P-42-100 (29238 - 32811, n=7) | |
| Microsoft Surface Laptop Go 3 | |
| 7-Zip 18.03 / 7z b 4 -mmt1 | |
| Durchschnitt der Klasse Subnotebook (2643 - 6442, n=69, der letzten 2 Jahre) | |
| Framework Laptop 13.5 Core Ultra 7 155H | |
| Microsoft Surface Laptop 7 13.8 Copilot+ | |
| Dell XPS 13 9345 | |
| Microsoft Surface Laptop Go 3 | |
| Microsoft Surface Laptop 13 | |
| Durchschnittliche Qualcomm Snapdragon X Plus X1P-42-100 (4087 - 4675, n=7) | |
| HWBOT x265 Benchmark v2.2 / 4k Preset | |
| Framework Laptop 13.5 Core Ultra 7 155H | |
| Durchschnitt der Klasse Subnotebook (0.97 - 25.1, n=70, der letzten 2 Jahre) | |
| Microsoft Surface Laptop 7 13.8 Copilot+ | |
| Dell XPS 13 9345 | |
| Microsoft Surface Laptop Go 3 | |
| Durchschnittliche Qualcomm Snapdragon X Plus X1P-42-100 (3.16 - 6.02, n=7) | |
| Microsoft Surface Laptop 13 | |
| LibreOffice / 20 Documents To PDF | |
| Microsoft Surface Laptop 7 13.8 Copilot+ | |
| Microsoft Surface Laptop 13 | |
| Durchschnittliche Qualcomm Snapdragon X Plus X1P-42-100 (55.3 - 62.7, n=7) | |
| Durchschnitt der Klasse Subnotebook (38.5 - 220, n=68, der letzten 2 Jahre) | |
| Microsoft Surface Laptop Go 3 | |
| Dell XPS 13 9345 | |
| Framework Laptop 13.5 Core Ultra 7 155H | |
| R Benchmark 2.5 / Overall mean | |
| Microsoft Surface Laptop 13 | |
| Durchschnittliche Qualcomm Snapdragon X Plus X1P-42-100 (0.728 - 0.777, n=7) | |
| Dell XPS 13 9345 | |
| Microsoft Surface Laptop 7 13.8 Copilot+ | |
| Microsoft Surface Laptop Go 3 | |
| Durchschnitt der Klasse Subnotebook (0.403 - 1.456, n=70, der letzten 2 Jahre) | |
| Framework Laptop 13.5 Core Ultra 7 155H | |
* ... kleinere Werte sind besser
AIDA64: FP32 Ray-Trace | FPU Julia | CPU SHA3 | CPU Queen | FPU SinJulia | FPU Mandel | CPU AES | CPU ZLib | FP64 Ray-Trace | CPU PhotoWorxx
| Performance Rating | |
| Framework Laptop 13.5 Core Ultra 7 155H | |
| Durchschnitt der Klasse Subnotebook | |
| Microsoft Surface Laptop 7 13.8 Copilot+ | |
| Dell XPS 13 9345 | |
| Microsoft Surface Laptop 13 | |
| Durchschnittliche Qualcomm Snapdragon X Plus X1P-42-100 | |
| Microsoft Surface Laptop Go 3 | |
| AIDA64 / FP32 Ray-Trace | |
| Durchschnitt der Klasse Subnotebook (1135 - 32888, n=70, der letzten 2 Jahre) | |
| Framework Laptop 13.5 Core Ultra 7 155H | |
| Microsoft Surface Laptop 7 13.8 Copilot+ | |
| Dell XPS 13 9345 | |
| Microsoft Surface Laptop 13 | |
| Durchschnittliche Qualcomm Snapdragon X Plus X1P-42-100 (1480 - 6185, n=7) | |
| Microsoft Surface Laptop Go 3 | |
| AIDA64 / FPU Julia | |
| Framework Laptop 13.5 Core Ultra 7 155H | |
| Durchschnitt der Klasse Subnotebook (5218 - 123315, n=70, der letzten 2 Jahre) | |
| Microsoft Surface Laptop 7 13.8 Copilot+ | |
| Dell XPS 13 9345 | |
| Microsoft Surface Laptop Go 3 | |
| Microsoft Surface Laptop 13 | |
| Durchschnittliche Qualcomm Snapdragon X Plus X1P-42-100 (14234 - 17585, n=7) | |
| AIDA64 / CPU SHA3 | |
| Microsoft Surface Laptop 7 13.8 Copilot+ | |
| Durchschnitt der Klasse Subnotebook (444 - 5287, n=70, der letzten 2 Jahre) | |
| Dell XPS 13 9345 | |
| Framework Laptop 13.5 Core Ultra 7 155H | |
| Durchschnittliche Qualcomm Snapdragon X Plus X1P-42-100 (2036 - 2614, n=7) | |
| Microsoft Surface Laptop 13 | |
| Microsoft Surface Laptop Go 3 | |
| AIDA64 / CPU Queen | |
| Framework Laptop 13.5 Core Ultra 7 155H | |
| Durchschnitt der Klasse Subnotebook (10579 - 115682, n=70, der letzten 2 Jahre) | |
| Microsoft Surface Laptop 7 13.8 Copilot+ | |
| Dell XPS 13 9345 | |
| Microsoft Surface Laptop Go 3 | |
| Microsoft Surface Laptop 13 | |
| Durchschnittliche Qualcomm Snapdragon X Plus X1P-42-100 (44346 - 48581, n=7) | |
| AIDA64 / FPU SinJulia | |
| Framework Laptop 13.5 Core Ultra 7 155H | |
| Durchschnitt der Klasse Subnotebook (744 - 18418, n=70, der letzten 2 Jahre) | |
| Microsoft Surface Laptop Go 3 | |
| Microsoft Surface Laptop 7 13.8 Copilot+ | |
| Dell XPS 13 9345 | |
| Microsoft Surface Laptop 13 | |
| Durchschnittliche Qualcomm Snapdragon X Plus X1P-42-100 (1240 - 1502, n=7) | |
| AIDA64 / FPU Mandel | |
| Durchschnitt der Klasse Subnotebook (3341 - 65433, n=70, der letzten 2 Jahre) | |
| Framework Laptop 13.5 Core Ultra 7 155H | |
| Microsoft Surface Laptop 7 13.8 Copilot+ | |
| Dell XPS 13 9345 | |
| Microsoft Surface Laptop Go 3 | |
| Microsoft Surface Laptop 13 | |
| Durchschnittliche Qualcomm Snapdragon X Plus X1P-42-100 (4929 - 9929, n=7) | |
| AIDA64 / CPU AES | |
| Microsoft Surface Laptop 7 13.8 Copilot+ | |
| Dell XPS 13 9345 | |
| Framework Laptop 13.5 Core Ultra 7 155H | |
| Durchschnitt der Klasse Subnotebook (638 - 161430, n=70, der letzten 2 Jahre) | |
| Microsoft Surface Laptop 13 | |
| Durchschnittliche Qualcomm Snapdragon X Plus X1P-42-100 (37646 - 45232, n=7) | |
| Microsoft Surface Laptop Go 3 | |
| AIDA64 / CPU ZLib | |
| Framework Laptop 13.5 Core Ultra 7 155H | |
| Durchschnitt der Klasse Subnotebook (164.9 - 1379, n=70, der letzten 2 Jahre) | |
| Microsoft Surface Laptop 7 13.8 Copilot+ | |
| Dell XPS 13 9345 | |
| Microsoft Surface Laptop 13 | |
| Durchschnittliche Qualcomm Snapdragon X Plus X1P-42-100 (473 - 521, n=7) | |
| Microsoft Surface Laptop Go 3 | |
| AIDA64 / FP64 Ray-Trace | |
| Durchschnitt der Klasse Subnotebook (610 - 17495, n=70, der letzten 2 Jahre) | |
| Framework Laptop 13.5 Core Ultra 7 155H | |
| Microsoft Surface Laptop 7 13.8 Copilot+ | |
| Dell XPS 13 9345 | |
| Durchschnittliche Qualcomm Snapdragon X Plus X1P-42-100 (2262 - 3399, n=7) | |
| Microsoft Surface Laptop 13 | |
| Microsoft Surface Laptop Go 3 | |
| AIDA64 / CPU PhotoWorxx | |
| Framework Laptop 13.5 Core Ultra 7 155H | |
| Durchschnitt der Klasse Subnotebook (6569 - 64588, n=70, der letzten 2 Jahre) | |
| Microsoft Surface Laptop 7 13.8 Copilot+ | |
| Dell XPS 13 9345 | |
| Microsoft Surface Laptop Go 3 | |
| Microsoft Surface Laptop 13 | |
| Durchschnittliche Qualcomm Snapdragon X Plus X1P-42-100 (31088 - 32139, n=7) | |
System Performance
Im Alltag ist der Surface Laptop 13 reaktionsschnell und viele Nutzer sollten auch keine Kompatibilitätsprobleme haben, nur beim Einsatz von älterer Software sollte man vorher recherchieren. Stabilitätsprobleme gab es grundsätzlich nicht, lediglich bei Gaming-Benchmarks hat sich unser Testgerät zweimal aufgehängt.
CrossMark: Overall | Productivity | Creativity | Responsiveness
WebXPRT 3: Overall
WebXPRT 4: Overall
Mozilla Kraken 1.1: Total
| Performance Rating | |
| Apple MacBook Air 13 M4 Entry | |
| Apple MacBook Air 13 M3 10C GPU | |
| Microsoft Surface Laptop 7 13.8 Copilot+ | |
| Dell XPS 13 9345 | |
| Framework Laptop 13.5 Core Ultra 7 155H | |
| Durchschnitt der Klasse Subnotebook | |
| Microsoft Surface Laptop 13 | |
| Durchschnittliche Qualcomm Snapdragon X Plus X1P-42-100, Qualcomm SD X Adreno X1-45 1.7 TFLOPS | |
| Microsoft Surface Laptop Go 3 | |
| CrossMark / Overall | |
| Apple MacBook Air 13 M4 Entry | |
| Apple MacBook Air 13 M3 10C GPU | |
| Framework Laptop 13.5 Core Ultra 7 155H | |
| Durchschnitt der Klasse Subnotebook (365 - 2038, n=68, der letzten 2 Jahre) | |
| Microsoft Surface Laptop 7 13.8 Copilot+ | |
| Dell XPS 13 9345 | |
| Microsoft Surface Laptop Go 3 | |
| Durchschnittliche Qualcomm Snapdragon X Plus X1P-42-100, Qualcomm SD X Adreno X1-45 1.7 TFLOPS (1061 - 1463, n=7) | |
| Microsoft Surface Laptop 13 | |
| CrossMark / Productivity | |
| Apple MacBook Air 13 M4 Entry | |
| Apple MacBook Air 13 M3 10C GPU | |
| Framework Laptop 13.5 Core Ultra 7 155H | |
| Durchschnitt der Klasse Subnotebook (364 - 1918, n=68, der letzten 2 Jahre) | |
| Microsoft Surface Laptop 7 13.8 Copilot+ | |
| Microsoft Surface Laptop Go 3 | |
| Dell XPS 13 9345 | |
| Durchschnittliche Qualcomm Snapdragon X Plus X1P-42-100, Qualcomm SD X Adreno X1-45 1.7 TFLOPS (1059 - 1284, n=7) | |
| Microsoft Surface Laptop 13 | |
| CrossMark / Creativity | |
| Apple MacBook Air 13 M4 Entry | |
| Apple MacBook Air 13 M3 10C GPU | |
| Framework Laptop 13.5 Core Ultra 7 155H | |
| Durchschnitt der Klasse Subnotebook (372 - 2396, n=68, der letzten 2 Jahre) | |
| Microsoft Surface Laptop 7 13.8 Copilot+ | |
| Dell XPS 13 9345 | |
| Microsoft Surface Laptop Go 3 | |
| Durchschnittliche Qualcomm Snapdragon X Plus X1P-42-100, Qualcomm SD X Adreno X1-45 1.7 TFLOPS (1070 - 1630, n=7) | |
| Microsoft Surface Laptop 13 | |
| CrossMark / Responsiveness | |
| Apple MacBook Air 13 M4 Entry | |
| Apple MacBook Air 13 M3 10C GPU | |
| Framework Laptop 13.5 Core Ultra 7 155H | |
| Microsoft Surface Laptop 7 13.8 Copilot+ | |
| Durchschnitt der Klasse Subnotebook (312 - 1889, n=68, der letzten 2 Jahre) | |
| Dell XPS 13 9345 | |
| Durchschnittliche Qualcomm Snapdragon X Plus X1P-42-100, Qualcomm SD X Adreno X1-45 1.7 TFLOPS (989 - 1563, n=7) | |
| Microsoft Surface Laptop Go 3 | |
| Microsoft Surface Laptop 13 | |
| WebXPRT 3 / Overall | |
| Apple MacBook Air 13 M4 Entry | |
| Apple MacBook Air 13 M3 10C GPU | |
| Microsoft Surface Laptop 7 13.8 Copilot+ | |
| Dell XPS 13 9345 | |
| Microsoft Surface Laptop 13 | |
| Durchschnittliche Qualcomm Snapdragon X Plus X1P-42-100, Qualcomm SD X Adreno X1-45 1.7 TFLOPS (129.9 - 426, n=7) | |
| Durchschnitt der Klasse Subnotebook (156 - 482, n=68, der letzten 2 Jahre) | |
| Framework Laptop 13.5 Core Ultra 7 155H | |
| Microsoft Surface Laptop Go 3 | |
| WebXPRT 4 / Overall | |
| Apple MacBook Air 13 M4 Entry | |
| Dell XPS 13 9345 | |
| Apple MacBook Air 13 M3 10C GPU | |
| Microsoft Surface Laptop 7 13.8 Copilot+ | |
| Durchschnitt der Klasse Subnotebook (132 - 348, n=68, der letzten 2 Jahre) | |
| Microsoft Surface Laptop 13 | |
| Framework Laptop 13.5 Core Ultra 7 155H | |
| Durchschnittliche Qualcomm Snapdragon X Plus X1P-42-100, Qualcomm SD X Adreno X1-45 1.7 TFLOPS (130.3 - 284, n=7) | |
| Microsoft Surface Laptop Go 3 | |
| Mozilla Kraken 1.1 / Total | |
| Durchschnittliche Qualcomm Snapdragon X Plus X1P-42-100, Qualcomm SD X Adreno X1-45 1.7 TFLOPS (408 - 1145, n=7) | |
| Microsoft Surface Laptop Go 3 | |
| Framework Laptop 13.5 Core Ultra 7 155H | |
| Durchschnitt der Klasse Subnotebook (265 - 1104, n=76, der letzten 2 Jahre) | |
| Dell XPS 13 9345 | |
| Microsoft Surface Laptop 13 | |
| Microsoft Surface Laptop 7 13.8 Copilot+ | |
| Apple MacBook Air 13 M3 10C GPU | |
| Apple MacBook Air 13 M4 Entry | |
* ... kleinere Werte sind besser
| AIDA64 / Memory Copy | |
| Durchschnitt der Klasse Subnotebook (14554 - 109035, n=70, der letzten 2 Jahre) | |
| Framework Laptop 13.5 Core Ultra 7 155H | |
| Dell XPS 13 9345 | |
| Microsoft Surface Laptop 13 | |
| Microsoft Surface Laptop 7 13.8 Copilot+ | |
| Durchschnittliche Qualcomm Snapdragon X Plus X1P-42-100 (61258 - 62525, n=7) | |
| Microsoft Surface Laptop Go 3 | |
| AIDA64 / Memory Read | |
| Microsoft Surface Laptop 13 | |
| Durchschnittliche Qualcomm Snapdragon X Plus X1P-42-100 (123557 - 127282, n=7) | |
| Dell XPS 13 9345 | |
| Microsoft Surface Laptop 7 13.8 Copilot+ | |
| Framework Laptop 13.5 Core Ultra 7 155H | |
| Durchschnitt der Klasse Subnotebook (15948 - 127174, n=70, der letzten 2 Jahre) | |
| Microsoft Surface Laptop Go 3 | |
| AIDA64 / Memory Write | |
| Durchschnitt der Klasse Subnotebook (15709 - 117898, n=70, der letzten 2 Jahre) | |
| Microsoft Surface Laptop Go 3 | |
| Framework Laptop 13.5 Core Ultra 7 155H | |
| Microsoft Surface Laptop 13 | |
| Durchschnittliche Qualcomm Snapdragon X Plus X1P-42-100 (45782 - 47845, n=7) | |
| Dell XPS 13 9345 | |
| Microsoft Surface Laptop 7 13.8 Copilot+ | |
| AIDA64 / Memory Latency | |
| Framework Laptop 13.5 Core Ultra 7 155H | |
| Durchschnitt der Klasse Subnotebook (6.8 - 187.8, n=69, der letzten 2 Jahre) | |
| Microsoft Surface Laptop Go 3 | |
| Dell XPS 13 9345 | |
| Microsoft Surface Laptop 7 13.8 Copilot+ | |
| Durchschnittliche Qualcomm Snapdragon X Plus X1P-42-100 (6.8 - 7.7, n=4) | |
| Microsoft Surface Laptop 13 | |
* ... kleinere Werte sind besser
Massenspeicher
Der Surface Laptop 13 verwendet austauschbaren UFS-4.0-Speicher, wobei unser Testgerät die 512-GB-Variante ist (411 GB frei für den Nutzer). Die Transferraten sind mit maximal knapp 4 GB/s für den Alltag vollkommen in Ordnung und die Geschwindigkeit bleibt auch bei dauerhafter Belastung stabil.

* ... kleinere Werte sind besser
Dauerleistung Lesen: DiskSpd Read Loop, Queue Depth 8
GPU Leistung
Die Grafikleistung der Adreno X1-45 ist sehr gering und auch geringer als beim alten Surface Laptop Go 3. Alltägliche Aufgaben wie die Wiedergabe von hochauflösenden Videos sind zwar kein Problem, doch zum Spielen reicht es kaum, wobei hier auch Kompatibilitätsprobleme eine Rolle spielen. Wenn man spielen möchte, sollte man auf Streaming-Dienste wie beispielsweise Xbox Game Pass setzen.
| 3DMark 11 Performance | 4568 Punkte | |
| 3DMark Fire Strike Score | 3653 Punkte | |
| 3DMark Time Spy Score | 1069 Punkte | |
| 3DMark Steel Nomad Score | 228 Punkte | |
| 3DMark Steel Nomad Light Score | 1096 Punkte | |
| 3DMark Steel Nomad Light Unlimited Score | 1085 Punkte | |
Hilfe | ||
| Blender / v3.3 Classroom CPU | |
| Microsoft Surface Laptop Go 3 | |
| Durchschnittliche Qualcomm SD X Adreno X1-45 1.7 TFLOPS (711 - 1226, n=9) | |
| Microsoft Surface Laptop 13 | |
| Microsoft Surface Laptop 7 13.8 Copilot+ | |
| Dell XPS 13 9345 | |
| Durchschnitt der Klasse Subnotebook (241 - 1127, n=72, der letzten 2 Jahre) | |
| Apple MacBook Air 13 M3 10C GPU | |
| Framework Laptop 13.5 Core Ultra 7 155H | |
| Apple MacBook Air 13 M4 Entry | |
| Blender / v3.3 Classroom METAL | |
| Apple MacBook Air 13 M3 10C GPU | |
| Durchschnitt der Klasse Subnotebook (103 - 134, n=4, der letzten 2 Jahre) | |
| Apple MacBook Air 13 M4 Entry | |
| Blender / v3.3 Classroom oneAPI/Intel | |
| Durchschnitt der Klasse Subnotebook (210 - 368, n=8, der letzten 2 Jahre) | |
| Framework Laptop 13.5 Core Ultra 7 155H | |
* ... kleinere Werte sind besser
| Cyberpunk 2077 2.2 Phantom Liberty - 1920x1080 Ultra Preset (FSR off) | |
| Framework Laptop 13.5 Core Ultra 7 155H | |
| Durchschnitt der Klasse Subnotebook (8.48 - 31.4, n=53, der letzten 2 Jahre) | |
| Dell XPS 13 9345 | |
| Microsoft Surface Laptop 7 13.8 Copilot+ | |
| Apple MacBook Air 13 M4 Entry | |
| Microsoft Surface Laptop 13 | |
| GTA V - 1920x1080 Highest Settings possible AA:4xMSAA + FX AF:16x | |
| Microsoft Surface Laptop 7 13.8 Copilot+ | |
| Dell XPS 13 9345 | |
| Durchschnitt der Klasse Subnotebook (7.81 - 53, n=66, der letzten 2 Jahre) | |
| Framework Laptop 13.5 Core Ultra 7 155H | |
| Microsoft Surface Laptop 13 | |
| Final Fantasy XV Benchmark - 1280x720 Lite Quality | |
| Framework Laptop 13.5 Core Ultra 7 155H | |
| Durchschnitt der Klasse Subnotebook (21.4 - 111.6, n=73, der letzten 2 Jahre) | |
| Microsoft Surface Laptop 7 13.8 Copilot+ | |
| Dell XPS 13 9345 | |
| Microsoft Surface Laptop 13 | |
| Strange Brigade - 1920x1080 ultra AA:ultra AF:16 | |
| Framework Laptop 13.5 Core Ultra 7 155H | |
| Durchschnitt der Klasse Subnotebook (17.7 - 70.7, n=69, der letzten 2 Jahre) | |
| Microsoft Surface Laptop 7 13.8 Copilot+ | |
| Dell XPS 13 9345 | |
| Microsoft Surface Laptop 13 | |
| Dota 2 Reborn - 1920x1080 ultra (3/3) best looking | |
| Durchschnitt der Klasse Subnotebook (13 - 99.5, n=75, der letzten 2 Jahre) | |
| Framework Laptop 13.5 Core Ultra 7 155H | |
| Microsoft Surface Laptop 7 13.8 Copilot+ | |
| Dell XPS 13 9345 | |
| Microsoft Surface Laptop 13 | |
Cyberpunk 2077 ultra FPS-Diagramm
| min. | mittel | hoch | max. | |
|---|---|---|---|---|
| GTA V (2015) | 98.3 | 88.7 | 34 | 15.3 |
| Dota 2 Reborn (2015) | 80.4 | 64.1 | 37 | 29.9 |
| Final Fantasy XV Benchmark (2018) | 21.4 | |||
| X-Plane 11.11 (2018) | 33.3 | |||
| Strange Brigade (2018) | 86.7 | 29.8 | 23 | 20 |
| Baldur's Gate 3 (2023) | 13.4 | 11.1 | ||
| Cyberpunk 2077 2.2 Phantom Liberty (2023) | 15.3 | 11.7 | 9.96 | 8.55 |
Emissionen & Energie
Geräuschemissionen
Der Surface Laptop 13 bleibt im Alltag fast immer lautlos und man hört den Lüfter nur, wenn man spielt oder aber den Prozessor stark belastet. Dann wird es mit 43,6 dB(A) allerdings auch sehr laut. Sonstige elektronische Geräusche gab es beim Testgerät nicht.
Lautstärkediagramm
| Idle |
| 23.5 / 23.5 / 23.5 dB(A) |
| Last |
| 23.5 / 43.6 dB(A) |
 | ||
30 dB leise 40 dB(A) deutlich hörbar 50 dB(A) störend |
||
min: | ||
| Microsoft Surface Laptop 13 Adreno X1-45 1.7 TFLOPS, SD X Plus X1P-42-100 | Microsoft Surface Laptop 7 13.8 Copilot+ Adreno X1-85 3.8 TFLOPS, SD X Elite X1E-80-100, Samsung MZ9L4512HBLU-00BMV | Apple MacBook Air 13 M4 Entry M4 8-Core GPU, M4 (10 cores), Apple SSD AP0256Z | Apple MacBook Air 13 M3 10C GPU M3 10-Core GPU, M3, Apple SSD AP0512Z | Dell XPS 13 9345 Adreno X1-85 3.8 TFLOPS, SD X Elite X1E-80-100 | Framework Laptop 13.5 Core Ultra 7 155H Arc 8-Core, Ultra 7 155H | Microsoft Surface Laptop Go 3 Iris Xe G7 80EUs, i5-1235U, Kioxia BG5 KBG50ZNS256G | |
|---|---|---|---|---|---|---|---|
| Geräuschentwicklung | -2% | -8% | -20% | -1% | |||
| aus / Umgebung * | 23.5 | 23.8 -1% | 22.9 3% | 24 -2% | 22.5 4% | ||
| Idle min * | 23.5 | 23.8 -1% | 22.9 3% | 24.1 -3% | 22.5 4% | ||
| Idle avg * | 23.5 | 23.8 -1% | 22.9 3% | 25.1 -7% | 22.5 4% | ||
| Idle max * | 23.5 | 23.8 -1% | 22.9 3% | 27 -15% | 22.5 4% | ||
| Last avg * | 23.5 | 26 -11% | 32.8 -40% | 38.4 -63% | 31.3 -33% | ||
| Cyberpunk 2077 ultra * | 29.9 | 31.5 -5% | 40.6 -36% | 43.7 -46% | |||
| Last max * | 43.6 | 40.3 8% | 40.6 7% | 45.8 -5% | 39.1 10% | ||
| Witcher 3 ultra * | 37.8 |
* ... kleinere Werte sind besser
Temperatur
Im Alltag bleibt der Surface Laptop 13 sehr kühl und auch bei voller Belastung gibt es keine Temperaturprobleme, man kann das Gerät daher problemlos auf den Oberschenkeln abstellen.

(+) Die maximale Temperatur auf der Oberseite ist 39 °C. Im Vergleich liegt der Klassendurchschnitt bei 35.9 °C (von 21.4 bis 59 °C für die Klasse Subnotebook).
(±) Auf der Unterseite messen wir eine maximalen Wert von 42.2 °C (im Vergleich zum Durchschnitt von 39.3 °C).
(+) Ohne Last messen wir eine durchschnittliche Temperatur von 23.7 °C auf der Oberseite. Der Klassendurchschnitt erreicht 30.8 °C.
(+) 3: The average temperature for the upper side is 31.7 °C / 89 F, compared to the average of 30.8 °C / 87 F for the class Subnotebook.
(+) Die Handballen und der Touchpad-Bereich erreichen maximal 34.3 °C und damit die typische Hauttemperatur und fühlen sich daher nicht heiß an.
(-) Die durchschnittliche Handballen-Temperatur anderer getesteter Geräte war 28.2 °C (-6.1 °C).


| Microsoft Surface Laptop 13 Qualcomm Snapdragon X Plus X1P-42-100, Qualcomm SD X Adreno X1-45 1.7 TFLOPS | Microsoft Surface Laptop 7 13.8 Copilot+ Qualcomm Snapdragon X Elite X1E-80-100, Qualcomm SD X Adreno X1-85 3.8 TFLOPS | Apple MacBook Air 13 M4 Entry Apple M4 (10 cores), Apple M4 8-core GPU | Apple MacBook Air 13 M3 10C GPU Apple M3, Apple M3 10-Core GPU | Dell XPS 13 9345 Qualcomm Snapdragon X Elite X1E-80-100, Qualcomm SD X Adreno X1-85 3.8 TFLOPS | Framework Laptop 13.5 Core Ultra 7 155H Intel Core Ultra 7 155H, Intel Arc 8-Core iGPU | Microsoft Surface Laptop Go 3 Intel Core i5-1235U, Intel Iris Xe Graphics G7 80EUs | |
|---|---|---|---|---|---|---|---|
| Hitze | -8% | -4% | -1% | -20% | -13% | -7% | |
| Last oben max * | 39 | 47.1 -21% | 44.9 -15% | 44.3 -14% | 45.2 -16% | 42.8 -10% | 40.9 -5% |
| Last unten max * | 42.2 | 44.6 -6% | 42.6 -1% | 43.4 -3% | 44.2 -5% | 45.2 -7% | 47.2 -12% |
| Idle oben max * | 23.9 | 24.7 -3% | 23.9 -0% | 22.3 7% | 30.4 -27% | 27.2 -14% | 24.9 -4% |
| Idle unten max * | 24 | 24.5 -2% | 24 -0% | 22.1 8% | 31.6 -32% | 28.6 -19% | 25.9 -8% |
* ... kleinere Werte sind besser
Lautsprecher
Den Lautsprechern mangelt es zwar etwas an Bass, insgesamt ist die Klangqualität aber gut.
Microsoft Surface Laptop 13 Audio Analyse
(+) | Die Lautsprecher können relativ laut spielen (83.5 dB)
Bass 100 - 315 Hz
(-) | kaum Bass - 15.5% niedriger als der Median
(±) | durchschnittlich lineare Bass-Wiedergabe (10.7% Delta zum Vorgänger)
Mitteltöne 400 - 2000 Hz
(+) | ausgeglichene Mitten, vom Median nur 3.3% abweichend
(+) | lineare Mitten (4.3% Delta zum Vorgänger)
Hochtöne 2 - 16 kHz
(+) | ausgeglichene Hochtöne, vom Median nur 1.5% abweichend
(+) | sehr lineare Hochtöne (4.7% Delta zum Vorgänger)
Gesamt im hörbaren Bereich 100 - 16.000 Hz
(+) | hörbarer Bereich ist sehr linear (11.1% Abstand zum Median
Im Vergleich zu allen Geräten derselben Klasse
» 10% aller getesteten Geräte dieser Klasse waren besser, 2% vergleichbar, 87% schlechter
» Das beste Gerät hat einen Delta-Wert von 5%, durchschnittlich ist 19%, das schlechteste Gerät hat 53%
Im Vergleich zu allen Geräten im Test
» 6% aller getesteten Geräte waren besser, 2% vergleichbar, 93% schlechter
» Das beste Gerät hat einen Delta-Wert von 4%, durchschnittlich ist 24%, das schlechteste Gerät hat 134%
Microsoft Surface Laptop 7 13.8 Copilot+ Audio Analyse
(±) | Mittelmäßig laut spielende Lautsprecher (81.8 dB)
Bass 100 - 315 Hz
(±) | abgesenkter Bass - 12.7% geringer als der Median
(±) | durchschnittlich lineare Bass-Wiedergabe (9.8% Delta zum Vorgänger)
Mitteltöne 400 - 2000 Hz
(+) | ausgeglichene Mitten, vom Median nur 4.1% abweichend
(+) | lineare Mitten (2.4% Delta zum Vorgänger)
Hochtöne 2 - 16 kHz
(+) | ausgeglichene Hochtöne, vom Median nur 2.1% abweichend
(+) | sehr lineare Hochtöne (2.5% Delta zum Vorgänger)
Gesamt im hörbaren Bereich 100 - 16.000 Hz
(+) | hörbarer Bereich ist sehr linear (12.1% Abstand zum Median
Im Vergleich zu allen Geräten derselben Klasse
» 14% aller getesteten Geräte dieser Klasse waren besser, 4% vergleichbar, 82% schlechter
» Das beste Gerät hat einen Delta-Wert von 5%, durchschnittlich ist 19%, das schlechteste Gerät hat 53%
Im Vergleich zu allen Geräten im Test
» 8% aller getesteten Geräte waren besser, 2% vergleichbar, 89% schlechter
» Das beste Gerät hat einen Delta-Wert von 4%, durchschnittlich ist 24%, das schlechteste Gerät hat 134%
Dell XPS 13 9345 Audio Analyse
(+) | Die Lautsprecher können relativ laut spielen (82.3 dB)
Bass 100 - 315 Hz
(±) | abgesenkter Bass - 9.9% geringer als der Median
(±) | durchschnittlich lineare Bass-Wiedergabe (12.4% Delta zum Vorgänger)
Mitteltöne 400 - 2000 Hz
(+) | ausgeglichene Mitten, vom Median nur 1.9% abweichend
(+) | lineare Mitten (3.2% Delta zum Vorgänger)
Hochtöne 2 - 16 kHz
(+) | ausgeglichene Hochtöne, vom Median nur 1.5% abweichend
(+) | sehr lineare Hochtöne (3% Delta zum Vorgänger)
Gesamt im hörbaren Bereich 100 - 16.000 Hz
(+) | hörbarer Bereich ist sehr linear (8.2% Abstand zum Median
Im Vergleich zu allen Geräten derselben Klasse
» 2% aller getesteten Geräte dieser Klasse waren besser, 1% vergleichbar, 97% schlechter
» Das beste Gerät hat einen Delta-Wert von 5%, durchschnittlich ist 19%, das schlechteste Gerät hat 53%
Im Vergleich zu allen Geräten im Test
» 1% aller getesteten Geräte waren besser, 1% vergleichbar, 98% schlechter
» Das beste Gerät hat einen Delta-Wert von 4%, durchschnittlich ist 24%, das schlechteste Gerät hat 134%
Framework Laptop 13.5 Core Ultra 7 155H Audio Analyse
(±) | Mittelmäßig laut spielende Lautsprecher (79.8 dB)
Bass 100 - 315 Hz
(±) | abgesenkter Bass - 14.5% geringer als der Median
(±) | durchschnittlich lineare Bass-Wiedergabe (8.2% Delta zum Vorgänger)
Mitteltöne 400 - 2000 Hz
(+) | ausgeglichene Mitten, vom Median nur 3.6% abweichend
(+) | lineare Mitten (3.5% Delta zum Vorgänger)
Hochtöne 2 - 16 kHz
(+) | ausgeglichene Hochtöne, vom Median nur 2.5% abweichend
(+) | sehr lineare Hochtöne (4.1% Delta zum Vorgänger)
Gesamt im hörbaren Bereich 100 - 16.000 Hz
(+) | hörbarer Bereich ist sehr linear (14.7% Abstand zum Median
Im Vergleich zu allen Geräten derselben Klasse
» 10% aller getesteten Geräte dieser Klasse waren besser, 4% vergleichbar, 86% schlechter
» Das beste Gerät hat einen Delta-Wert von 7%, durchschnittlich ist 21%, das schlechteste Gerät hat 53%
Im Vergleich zu allen Geräten im Test
» 18% aller getesteten Geräte waren besser, 4% vergleichbar, 78% schlechter
» Das beste Gerät hat einen Delta-Wert von 4%, durchschnittlich ist 24%, das schlechteste Gerät hat 134%
Microsoft Surface Laptop Go 3 Audio Analyse
(±) | Mittelmäßig laut spielende Lautsprecher (79 dB)
Bass 100 - 315 Hz
(-) | kaum Bass - 18.7% niedriger als der Median
(±) | durchschnittlich lineare Bass-Wiedergabe (9.8% Delta zum Vorgänger)
Mitteltöne 400 - 2000 Hz
(+) | ausgeglichene Mitten, vom Median nur 4.8% abweichend
(+) | lineare Mitten (5.2% Delta zum Vorgänger)
Hochtöne 2 - 16 kHz
(+) | ausgeglichene Hochtöne, vom Median nur 1.1% abweichend
(+) | sehr lineare Hochtöne (2.7% Delta zum Vorgänger)
Gesamt im hörbaren Bereich 100 - 16.000 Hz
(±) | hörbarer Bereich ist durchschnittlich linear (15.4% Abstand zum Median)
Im Vergleich zu allen Geräten derselben Klasse
» 34% aller getesteten Geräte dieser Klasse waren besser, 5% vergleichbar, 61% schlechter
» Das beste Gerät hat einen Delta-Wert von 5%, durchschnittlich ist 19%, das schlechteste Gerät hat 53%
Im Vergleich zu allen Geräten im Test
» 21% aller getesteten Geräte waren besser, 4% vergleichbar, 75% schlechter
» Das beste Gerät hat einen Delta-Wert von 4%, durchschnittlich ist 24%, das schlechteste Gerät hat 134%
Energieaufnahme
Der neue Surface Laptop 13 ist sehr sparsam und benötigt im Leerlauf gerade mal etwas mehr als 5 Watt. Unter Last sind bis zu 60 Watt möglich, was sich dann aber bei rund 40 Watt einpendelt. Microsoft empfiehlt ein 45-Watt-Netzteil, wir würden aber ein 65-Watt-Modul empfehlen.
| Aus / Standby | |
| Idle | |
| Last |
|
Legende:
min: | |
| Microsoft Surface Laptop 13 Adreno X1-45 1.7 TFLOPS, SD X Plus X1P-42-100 | Microsoft Surface Laptop 7 13.8 Copilot+ Adreno X1-85 3.8 TFLOPS, SD X Elite X1E-80-100, Samsung MZ9L4512HBLU-00BMV | Apple MacBook Air 13 M4 Entry M4 8-Core GPU, M4 (10 cores), Apple SSD AP0256Z | Apple MacBook Air 13 M3 10C GPU M3 10-Core GPU, M3, Apple SSD AP0512Z | Dell XPS 13 9345 Adreno X1-85 3.8 TFLOPS, SD X Elite X1E-80-100 | Framework Laptop 13.5 Core Ultra 7 155H Arc 8-Core, Ultra 7 155H | Microsoft Surface Laptop Go 3 Iris Xe G7 80EUs, i5-1235U, Kioxia BG5 KBG50ZNS256G | |
|---|---|---|---|---|---|---|---|
| Stromverbrauch | -30% | -28% | -49% | -63% | -87% | -81% | |
| Idle min * | 1.8 | 1.4 22% | 1.9 -6% | 1.95 -8% | 2.8 -56% | 2.5 -39% | 4.8 -167% |
| Idle avg * | 5.1 | 6.3 -24% | 8.7 -71% | 8.7 -71% | 4.9 4% | 5.2 -2% | 8.3 -63% |
| Idle max * | 5.6 | 7.6 -36% | 8.8 -57% | 8.9 -59% | 5.7 -2% | 5.8 -4% | 8.9 -59% |
| Last avg * | 13.8 | 26.9 -95% | 29.9 -117% | 34.3 -149% | 40.6 -194% | 47.5 -244% | 34.7 -151% |
| Cyberpunk 2077 ultra * | 21.8 | 38.5 -77% | 18.5 15% | 40.7 -87% | 54.5 -150% | ||
| Cyberpunk 2077 ultra external monitor * | 19.4 | 21.5 -11% | 39.4 -103% | 52.4 -170% | |||
| Last max * | 60.2 | 40.7 32% | 30.8 49% | 35.4 41% | 64 -6% | 61.5 -2% | 38.6 36% |
| Witcher 3 ultra * | 28.6 | 32.9 |
* ... kleinere Werte sind besser
Energieaufnahme Cyberpunk / Stresstest
Energieaufnahme mit externem Monitor
Akkulaufzeit
Die Akkulaufzeiten des Surface Laptop 13 sind sehr gut, vor allem in Anbetracht des vergleichsweise kleinen 50-Wh-Akkus. Im WLAN-Test mit 150 cd/m² (63 % der maximalen Helligkeit) ermitteln wir sehr gute 16:41 Stunden und bei voller Helligkeit immer noch 11:22 Stunden. Mit einem 65-Watt-Netzteil benötigt ein Ladevorgang 131 Minuten (80 % nach 63 Minuten).
Notebookcheck Gesamtbewertung
Microsoft Surface Laptop 13
- 05.06.2025 v8
Andreas Osthoff
 Total Sustainability Score:
 Mögliche Alternativen im Vergleich
Bild | Modell / Test | Preis ab | Gewicht | Dicke | Display |
|---|---|---|---|---|---|
1. 84.3%  | Microsoft Surface Laptop 13 Qualcomm Snapdragon X Plus X1P-42-100 ⎘ Qualcomm SD X Adreno X1-45 1.7 TFLOPS ⎘ 16 GB RAM | Amazon: 1.133,00 € Listenpreis: 1219€ | 1.2 kg | 15.6 mm | 13.00" 1920x1280 178 PPI IPS |
2. 86.2%  | Microsoft Surface Laptop 7 13.8 Copilot+ Qualcomm Snapdragon X Elite X1E-80-100 ⎘ Qualcomm SD X Adreno X1-85 3.8 TFLOPS ⎘ 16 GB RAM, 512 GB SSD | Amazon: 1.429,39 € Bestpreis 1279€ Media Markt.at 2. 1299€ Warenstube Bender 3. 1390.2€ galaxus.at | 1.3 kg | 17.5 mm | 13.80" 2304x1536 201 PPI IPS |
3. 91.2%  | Apple MacBook Air 13 M4 Entry Apple M4 (10 cores) ⎘ Apple M4 8-core GPU ⎘ 16 GB RAM, 256 GB SSD | Amazon: 1.029,00 € Bestpreis 979€ Cyberport Stores Österreich 2. 979€ Cyberport Stores Deutschland 3. 984€ MacTrade | 1.2 kg | 11.3 mm | 13.60" 2560x1664 225 PPI IPS |
4. 92.4% v7 (old)  | Apple MacBook Air 13 M3 10C GPU Apple M3 ⎘ Apple M3 10-Core GPU ⎘ 16 GB RAM, 512 GB SSD | Amazon: 748,39 € Bestpreis 1055.95€ electronis.de 2. 1058.98€ Jacob Elektronik direkt 3. 1058.98€ Jacob Elektronik direkt | 1.2 kg | 11.3 mm | 13.60" 2560x1664 225 PPI IPS |
5. 84.5%  | Dell XPS 13 9345 Qualcomm Snapdragon X Elite X1E-80-100 ⎘ Qualcomm SD X Adreno X1-85 3.8 TFLOPS ⎘ 16 GB RAM | Amazon: 1.399,00 € Geizhals Suche | 1.2 kg | 15.3 mm | 13.40" 1920x1200 169 PPI IPS |
6. 84%  | Framework Laptop 13.5 Core Ultra 7 155H Intel Core Ultra 7 155H ⎘ Intel Arc 8-Core iGPU ⎘ 32 GB RAM | Amazon: 1. 799,00 € Samsung Galaxy Book3 360 Lap... 2. 649,99 € HP Pavilion x360 2-in-1 Lapt... 3. 549,00 € HP Pavilion x360 Laptop | 14... Listenpreis: 1500 USD | 1.4 kg | 15.85 mm | 13.50" 2880x1920 256 PPI IPS |
7. 83.3% v7 (old)  | Microsoft Surface Laptop Go 3 Intel Core i5-1235U ⎘ Intel Iris Xe Graphics G7 80EUs ⎘ 16 GB RAM, 512 GB SSD | Amazon: 579,77 € Bestpreis 920.48€ NRE - Computer & Service 2. 920.48€ CLS-IT | 1.1 kg | 15.7 mm | 12.40" 1536x1024 149 PPI IPS |
Weitere Artikel zur Serie
Microsoft Surface Laptop 13 (Surface Laptop 13 Serie)Verwandte Artikel


Transparenz
Die Auswahl der zu testenden Geräte erfolgt innerhalb der Redaktion. Das vorliegende Testmuster wurde dem Autor vom Hersteller oder einem Shop zu Testzwecken leihweise zur Verfügung gestellt. Eine Einflussnahme des Leihstellers auf den Testbericht gab es nicht, der Hersteller erhielt keine Version des Reviews vor der Veröffentlichung. Es bestand keine Verpflichtung zur Publikation. Unsere Reviews erfolgen stets ohne Gegenleistung oder Kompensationen. Als eigenständiges, unabhängiges Unternehmen unterliegt Notebookcheck keiner Diktion von Herstellern, Shops und Verlagen.
So testet Notebookcheck
Pro Jahr werden von Notebookcheck hunderte Laptops und Smartphones unabhängig in von uns standardisierten technischen Verfahren getestet, um eine Vergleichbarkeit aller Testergebnisse zu gewährleisten. Seit rund 20 Jahren entwickeln wir diese Testmethoden kontinuierlich weiter und setzen damit Branchenstandards. In unseren Testlaboren kommt ausschließlich hochwertiges Messequipment in die Hände erfahrener Techniker und Redakteure. Die Tests unterliegen einer mehrstufigen Kontrolle. Unsere komplexe Gesamtbewertung basiert auf hunderten fundierten Messergebnissen und Benchmarks, womit Ihnen Objektivität garantiert ist. Weitere Informationen zu unseren Testmethoden gibt es hier.
