Notebookcheck Logo
Teaser

Test Dell Pro 13 Premium: Der fast perfekte Business-Laptop

Der "Promium"-Laptop. Update.

Wir testen hier den nominell besten 13-Zoll-Businesslaptop aus Dells Produktreihe. Das Dell Pro 13 Premium richtet sich an anspruchsvolle Business-Nutzer und soll mit modernen Anschlüssen, einem stabilen, aber leichten Magnesiumgehäuse, KI und sehr langer Akkulaufzeit bei Unternehmern punkten. Update: Bessere SSD-Werte.
Christian Hintze 👁, Andrea Grüblinger Veröffentlicht am 🇺🇸 🇫🇷 ...
AI Business Intel Laptop / Notebook Lunar Lake Security Thunderbolt

Fazit - Nahezu kompletter Business-Laptop

Das Dell Pro 13 Premium ist ein toller Business-Laptop fast ohne Schwächen, aber jeder Menge positiver Merkmale, die dem mobilen Laptop unseren Award einbringen. Unternehmensmitarbeiter und andere Interessierte erhalten hier einen kompakten, kleinen, leichten, sparsamen und extrem ausdauernden (24 Stunden!) sowie leistungsstarken Laptop mit hochwertig verarbeitetem Magnesiumgehäuse, hochauflösender 8-MP-Webcam und modernen Schnittstellen wie zweifach-Thunderbolt-4 und Wi-Fi 7. Zudem bleibt der Laptop in quasi allen Situationen gleichmäßig gut gekühlt. 

Download der lizensierten Bewertungsgrafik als SVG / PNG

Das hat allerdings auch seinen Preis, denn der Laptop kostet mindestens 2.600 bis 3.000 Euro! Angesichts dessen ist die lahme M.2-2230-SSD beinahe unverschämt, im Alltag dürfte man den Unterschied hingegen kaum merken. Nachbesserungsbedarf gibt es höchstens beim Namen und der Aufrüstbarkeit.

Pro

+ stabiles Magnesiumgehäuse
+ 2x Thunderbolt 4, Wi-Fi 7, optionaler SIM-Slot
+ 8-MP-Webcam
+ gute (3D) Leistung
+ stets kühl
+ sparsam, sehr lange Akkulaufzeit

Contra

- kein LAN, kein Kartenleser
- lahme SSD
- nur 1 M.2-2230-Slot
- hoher Preis

Preis und Verfügbarkeit

Unser Testmodell mit FHD+-Display kostet bei Dell 2.690,23 Euro, bei Amazon 2.567 Euro.

Amazon Logo
2.703,52 €
Dell Pro 13 Premium PA13250, U7-268V, Evo, 32GB, 512GB SSD, 13.3" QHD+ Touch, IR Cam & Mic, FgrPr, 3 Cell, 65W, WLAN, vPro, Backlit Kb, W11 Pro, 3Y ProSpt
Bestpreis 2479.85€ MetaComp
Dell Pro 13 Premium PA13250, grau, Core Ultra 7 268V, 32GB RAM, 512GB SSD, DE (DJ2F2)
2. 2487.52 € XITRA.de
3. 2489.84 € galaxus.at
4. 2500.19 € Easynotebooks.de

Mögliche Alternativen im Vergleich

Bild
Modell / Test
Preis ab
Gewicht
Dicke
Display
1.
90%
Dell Pro 13 Premium PA13250
Intel Core Ultra 7 268V ⎘
Intel Arc Graphics 140V ⎘
32 GB RAM, 1024 GB SSD
Amazon: 2.703,52 €
Bestpreis 2479.85€ MetaComp
2. 2487.52€ XITRA.de
3. 2489.84€ galaxus.at
1.1 kg17.2 mm13.30"
1920x1200
170 PPI
IPS
2.
85%
MSI Prestige 13 AI Plus Evo A2VMG
Intel Core Ultra 7 258V ⎘
Intel Arc Graphics 140V ⎘
32 GB RAM
Bestpreis 1699€ Media Markt.at
2. 1799€ nullprozentshop.de
3. 1799€ notebooksbilliger.de1400 USD
970 g16.9 mm13.30"
2880x1800
255 PPI
OLED
3.
85.1%
Lenovo ThinkPad X13 2-in-1 Gen 5
Intel Core Ultra 7 165U ⎘
Intel Graphics 4-Core iGPU (Arc) ⎘
32 GB RAM, 1000 GB SSD
Amazon: 1.633,88 €
Bestpreis 1923.9€ Klarsicht IT
2. 1924€ MetaComp
3. 1926€ lapstars
1.3 kg16.4 mm13.30"
1920x1200
170 PPI
IPS
4.
84%
Framework Laptop 13.5 Core Ultra 7 155H
Intel Core Ultra 7 155H ⎘
Intel Arc 8-Core iGPU ⎘
32 GB RAM
Amazon:
1. 889,60 €
Samsung Galaxy Book3 360 Lap...
2. 1.563,90 €
MSI Prestige 13 AI Evo A1MG-...
3. 579,00 €
ASUS Vivobook 16 Laptop | 16...
Listenpreis: 1500 USD
1.4 kg15.85 mm13.50"
2880x1920
256 PPI
IPS
5.
85.3%
Dell XPS 13 9350
Dell XPS 13 9350
Intel Core Ultra 7 256V ⎘
Intel Arc Graphics 140V ⎘
16 GB RAM, 512 GB SSD
Amazon: 1.526,21 €
Geizhals Suche
1.2 kg15.3 mm13.40"
1920x1200
169 PPI
IPS
6.
80.7%
Microsoft Surface Pro Copilot+
Qualcomm Snapdragon X Plus X1P-64-100 ⎘
Qualcomm SD X Adreno X1-85 3.8 TFLOPS ⎘
16 GB RAM, 256 GB SSD
Amazon: 1.199,00 €
Bestpreis 1099€ Easynotebooks.de
2. 1099.01€ Notebook.de
3. 1104€ TechnikDirekt
872 g9.3 mm13.00"
2880x1920
266 PPI
IPS

Dell hat zuletzt sein Namensschema geändert. Mit der Pro-Reihe richtet sich Dell an den typischen Business-User, es ersetzt quasi die bisherige Latitude-Serie. Premium steht dabei für die besten Materialien und Ausstattungsmerkmale. Unser aktueller 13-Zoller bietet moderne Anschlüsse, viel Sicherheit, viel KI, ein stabiles Magnesiumgehäuse und ist trotzdem nur knapp über 1 kg leicht. Also der Premium-Laptop für Business-Anwender?

Update, 05.05.2025: Der Hersteller hat uns auf ungewöhnlich niedrige SSD-Werte hingewiesen. Wir haben die Messungen wiederholt und tatsächlich teils deutlich bessere Werte erreicht, siehe Abschnitt Leistung - Massenspeicher. Die Gesamtwertung erhöht sich von 89,9 auf glatt 90 Prozent.

Spezifikationen

Dell Pro 13 Premium
Prozessor
Intel Core Ultra 7 268V 8 x 2.2 - 5 GHz, Lunar Lake
RAM
32 GB 
Bildschirm
13.30 Zoll 16:10, 1920 x 1200 Pixel 170 PPI, B133UAN (AUOBEB0), IPS, Gorilla Glass, spiegelnd: nein, HDR, 60 Hz
Massenspeicher
Micron 2550 1TB, 1024 GB 
, 860 GB verfügbar
Soundkarte
Intel Lunar Lake SOC - cAVS (Audio, Voice, Speech)
Anschlüsse
1 USB 3.0 / 3.1 Gen1, 2 USB 4.0 40 Gbps, 2 Thunderbolt, USB-C Power Delivery (PD), 1 HDMI, 2 DisplayPort, 1 Kensington Lock, Audio Anschlüsse: Audio jack, 1 Fingerprint Reader
Netzwerk
Intel BE201 320MHz (a/b/g/h/n = Wi-Fi 4/ac = Wi-Fi 5/ax = Wi-Fi 6/ Wi-Fi 6E 6 GHz be = Wi-Fi 7), Bluetooth Bluetooth 5.4
Abmessungen
Höhe x Breite x Tiefe (in mm): 17.2 x 296 x 208.9
Akku
60 Wh
Laden
Schnellladen / Quick Charge
Betriebssystem
Microsoft Windows 11 Pro
Kamera
Webcam: 8 MP IR camera
Primary Camera: 8 MPix
Sonstiges
Lautsprecher: 2x 2 W stereo, Tastatur: Chiclet, Tastatur-Beleuchtung: ja, 24 Monate Garantie
Gewicht
1.145 kg, Netzteil: 325 g
Preis
2700 Euro
Geizhals
Preisvergleich
Geizhals Bestpreis 2479.85€ (Historischer Bestpreis: 2450.27€)
Dell Pro 13 Premium PA13250, grau, Core Ultra 7 268V, 32GB RAM, 512GB SSD, DE (DJ2F2)
Hinweis: Der Hersteller kann abweichende Bauteile wie Bildschirme, Laufwerke und Speicherriegel mit ähnlichen Spezifikationen unter dem gleichen Modellnamen einsetzen.


Gehäuse & Ausstattung - Dell mit 8-MP-Webcam

Das dunkelgraue Gehäuse besteht aus 90 Prozent recyceltem Magnesium. Sowohl Basis als auch 180-Grad-Deckel sind dadurch sehr stabil, Knarztöne hören wir nicht beim Verwinden. Das Design wirkt extrem kompakt, schlicht und trotzdem edel. 

Gleich zwei Thunderbolt-4-Anschlüsse, je einen an jeder Seite, bringt das Pro 13 Premium mit, dazu einen vollwertigen HDMI-Port. Im Powerbutton ist ein Fingerabdrucksensor integriert. Auf einen Kartenleser oder einen dedizierten LAN-Anschluss verzichtet man. Dafür hat das Dell Wi-Fi 7 an Bord. Ein SIM-Kartenslot ist optional.

Öffnen lässt sich der Business-Laptop recht leicht, die Kreuzschrauben verbleiben in der Bodenplatte. Aber innen sind RAM und Wi-Fi-Modul fest verbaut, die SSD ist nur vom kleinen M.2 2230-Format, einen zweiten Slot gibt es nicht.

Geöffnetes Dell Pro 13 Premium
Festes Wi-Fi-7-Modul
Heatcover der SSD
Heatcover der SSD
Die kleine 2230-SSD
Die kleine 2230-SSD

Mit gleich 8 MP ist die IR-Webcam ungewöhnlich hochauflösend. Das beschert dem Testbild eine gute Schärfe, die Farbabweichungen sind jedoch mittel bis hoch, vor allem im grünen Bereich. Das WiFi-7-Modul produziert konstant hohe Übertragungsraten.

Größenvergleich

301.7 mm 214.6 mm 16.4 mm 1.3 kg299 mm 210 mm 16.9 mm 970 g296 mm 208.9 mm 17.2 mm 1.1 kg295 mm 211 mm 18.2 mm 1.1 kg296.63 mm 228.98 mm 15.85 mm 1.4 kg295.3 mm 199.1 mm 15.3 mm 1.2 kg287 mm 209 mm 9.3 mm 872 g297 mm 210 mm 1 mm 5.7 g
Rechts: USB-A (5 Gb/s), Thunderbolt 4 (PD 3.1 & DP 2.1), Kensington
Links: HDMI 2.1, Thunderbolt 4 (PD 3.1 & DP 2.1), Headset
Vorne: Kamera-Shutter
Hinten: Keine Anschlüsse
Networking
iperf3 transmit AXE11000
Lenovo ThinkPad X13 2-in-1 Gen 5
Intel Wi-Fi 6E AX211
1598 (1383min - 1713max) MBit/s +64%
Durchschnittliche Intel BE201 320MHz
  (671 - 1978, n=24)
1443 MBit/s +48%
Durchschnitt der Klasse Subnotebook
  (467 - 1824, n=67, der letzten 2 Jahre)
1295 MBit/s +33%
Dell Pro 13 Premium PA13250
Intel BE201 320MHz
973 MBit/s
Dell XPS 13 9350
Intel BE201 320MHz
875 (599min - 1034max) MBit/s -10%
Framework Laptop 13.5 Core Ultra 7 155H
Intel Wi-Fi 6E AX210
710 (355min - 758max) MBit/s -27%
MSI Prestige 13 AI Plus Evo A2VMG
Intel Killer AX1775s 320MHz
644 (331min - 781max) MBit/s -34%
iperf3 receive AXE11000
Lenovo ThinkPad X13 2-in-1 Gen 5
Intel Wi-Fi 6E AX211
1668 (1619min - 1713max) MBit/s +88%
Durchschnittliche Intel BE201 320MHz
  (771 - 1755, n=24)
1521 MBit/s +72%
Durchschnitt der Klasse Subnotebook
  (772 - 1768, n=67, der letzten 2 Jahre)
1439 MBit/s +63%
Dell Pro 13 Premium PA13250
Intel BE201 320MHz
885 MBit/s
Framework Laptop 13.5 Core Ultra 7 155H
Intel Wi-Fi 6E AX210
848 (777min - 883max) MBit/s -4%
Dell XPS 13 9350
Intel BE201 320MHz
828 (763min - 865max) MBit/s -6%
MSI Prestige 13 AI Plus Evo A2VMG
Intel Killer AX1775s 320MHz
772 (626min - 835max) MBit/s -13%
iperf3 transmit AXE11000 6GHz
Dell Pro 13 Premium PA13250
Intel BE201 320MHz
1673 (1594min - 1720max) MBit/s
Lenovo ThinkPad X13 2-in-1 Gen 5
Intel Wi-Fi 6E AX211
1662 (1542min - 1723max) MBit/s -1%
Durchschnittliche Intel BE201 320MHz
  (854 - 2340, n=11)
1420 MBit/s -15%
MSI Prestige 13 AI Plus Evo A2VMG
Intel Killer AX1775s 320MHz
1303 (1200min - 1351max) MBit/s -22%
Durchschnitt der Klasse Subnotebook
  (642 - 1792, n=30, der letzten 2 Jahre)
1298 MBit/s -22%
Dell XPS 13 9350
Intel BE201 320MHz
1127 (1037min - 1292max) MBit/s -33%
Framework Laptop 13.5 Core Ultra 7 155H
Intel Wi-Fi 6E AX210
1047 (517min - 1099max) MBit/s -37%
iperf3 receive AXE11000 6GHz
Lenovo ThinkPad X13 2-in-1 Gen 5
Intel Wi-Fi 6E AX211
1657 (816min - 1687max) MBit/s +10%
Durchschnittliche Intel BE201 320MHz
  (1399 - 2087, n=11)
1648 MBit/s +10%
Dell XPS 13 9350
Intel BE201 320MHz
1620 (1578min - 1652max) MBit/s +8%
Durchschnitt der Klasse Subnotebook
  (1173 - 1784, n=30, der letzten 2 Jahre)
1540 MBit/s +3%
MSI Prestige 13 AI Plus Evo A2VMG
Intel Killer AX1775s 320MHz
1529 (1485min - 1555max) MBit/s +2%
Dell Pro 13 Premium PA13250
Intel BE201 320MHz
1502 (1380min - 1534max) MBit/s
Framework Laptop 13.5 Core Ultra 7 155H
Intel Wi-Fi 6E AX210
1065 (973min - 1117max) MBit/s -29%
050100150200250300350400450500550600650700750800850900950100010501100115012001250130013501400145015001550160016501700Tooltip
Dell Pro 13 Premium PA13250 Intel BE201 320MHz; iperf3 transmit AXE11000 6GHz; iperf 3.1.3: Ø1673 (1594-1720)
MSI Prestige 13 AI Plus Evo A2VMG Intel Killer AX1775s 320MHz; iperf3 transmit AXE11000 6GHz; iperf 3.1.3: Ø1303 (1200-1351)
Lenovo ThinkPad X13 2-in-1 Gen 5 Intel Wi-Fi 6E AX211; iperf3 transmit AXE11000 6GHz; iperf 3.1.3: Ø1662 (1542-1723)
Framework Laptop 13.5 Core Ultra 7 155H Intel Wi-Fi 6E AX210; iperf3 transmit AXE11000 6GHz; iperf 3.1.3: Ø1030 (517-1099)
Dell XPS 13 9350 Intel BE201 320MHz; iperf3 transmit AXE11000 6GHz; iperf 3.1.3: Ø1127 (1037-1292)
Dell Pro 13 Premium PA13250 Intel BE201 320MHz; iperf3 receive AXE11000 6GHz; iperf 3.1.3: Ø1501 (1380-1534)
MSI Prestige 13 AI Plus Evo A2VMG Intel Killer AX1775s 320MHz; iperf3 receive AXE11000 6GHz; iperf 3.1.3: Ø1528 (1485-1555)
Lenovo ThinkPad X13 2-in-1 Gen 5 Intel Wi-Fi 6E AX211; iperf3 receive AXE11000 6GHz; iperf 3.1.3: Ø1629 (816-1687)
Framework Laptop 13.5 Core Ultra 7 155H Intel Wi-Fi 6E AX210; iperf3 receive AXE11000 6GHz; iperf 3.1.3: Ø1064 (973-1117)
Dell XPS 13 9350 Intel BE201 320MHz; iperf3 receive AXE11000 6GHz; iperf 3.1.3: Ø1620 (1578-1652)
MSI Prestige 13 AI Plus Evo A2VMG Intel Killer AX1775s 320MHz; iperf3 transmit AXE11000; iperf 3.1.3: Ø633 (331-781)
Lenovo ThinkPad X13 2-in-1 Gen 5 Intel Wi-Fi 6E AX211; iperf3 transmit AXE11000; iperf 3.1.3: Ø1599 (1383-1713)
Framework Laptop 13.5 Core Ultra 7 155H Intel Wi-Fi 6E AX210; iperf3 transmit AXE11000; iperf 3.1.3: Ø698 (355-758)
Dell XPS 13 9350 Intel BE201 320MHz; iperf3 transmit AXE11000; iperf 3.1.3: Ø875 (599-1034)
MSI Prestige 13 AI Plus Evo A2VMG Intel Killer AX1775s 320MHz; iperf3 receive AXE11000; iperf 3.1.3: Ø771 (626-835)
Lenovo ThinkPad X13 2-in-1 Gen 5 Intel Wi-Fi 6E AX211; iperf3 receive AXE11000; iperf 3.1.3: Ø1667 (1619-1713)
Framework Laptop 13.5 Core Ultra 7 155H Intel Wi-Fi 6E AX210; iperf3 receive AXE11000; iperf 3.1.3: Ø848 (777-883)
Dell XPS 13 9350 Intel BE201 320MHz; iperf3 receive AXE11000; iperf 3.1.3: Ø828 (763-865)
ColorChecker
12.7 ∆E
6.2 ∆E
8.7 ∆E
16.7 ∆E
8.3 ∆E
7.3 ∆E
6.2 ∆E
9.6 ∆E
6.1 ∆E
9.1 ∆E
7.5 ∆E
5.5 ∆E
10.6 ∆E
13 ∆E
9.1 ∆E
5.2 ∆E
6.3 ∆E
10 ∆E
2.4 ∆E
4.7 ∆E
10.5 ∆E
14.4 ∆E
14 ∆E
4.5 ∆E
ColorChecker Dell Pro 13 Premium PA13250: 8.7 ∆E min: 2.44 - max: 16.74 ∆E

Nachhaltigkeit

Laut Dell ist das Pro 13 Premium ENERGY-STAR-zertifiziert und EPEAT-Gold-registriert und hat ein Climate+-Siegel. Es erfüllt zudem die neueste TCO-Generation-9-Zertifizierung in Sachen Energieverbrauch und Reparierbarkeit. 

Als Materialien kommen u. a. PCR-Kunststoff, recyceltes Magnesium, biobasierter Kunststoff und recyceltes Kobalt zum Einsatz, die Verpackung besteht aus 100 % recycelten oder erneuerbaren Materialien, insbesondere aus Pappe.

Eingabegeräte - 13 Premium mit Konferenz-Touchpad

Das Dell präsentiert ein sehr aufgeräumtes und kompaktes Layout mit großen Tasten (ca. 1,7 cm) ohne Abstand zueinander, die vertikalen Pfeiltasten sind höhenhalbiert. Der in die Tastatur integrierte Powerknopf oben rechts beherbergt gleichzeitig einen Fingerabdrucksensor.

Die Tasten haben einen flachen bis mittleren Hub, aber ein spürbares Feedback. Damit tippt es sich flott und die Anschlaggeräusche sind mehr als moderat. Der Stromverbrauch der 2-stufigen Hintergrundbeleuchtung soll dank Mini-LEDs um bis zu 75 Prozent reduziert worden sein.

Das Touchpad misst ca. 12,5 x 7,1 cm und hat als Besonderheit in der oberen Reihe mehrere Sondertasten für den Videochat (Kamera an/aus, Screenshare, Chat, Mikro an/aus). Die Touchsymbole sind nur während Zoom- oder Microsoft-Teams-Anrufen sichtbar. Eigentlich ist die Oberfläche sehr gleitfreudig, hat man sich aber gerade die Hände gewaschen oder aus sonstigem Grunde leicht feuchte Finger, dann stockt es stark. Die leisen Klicks der integrierten Maustasten haben ein angenehmes Feedback und lösen zuverlässig aus.

Die Tastatur
Die Tastatur
Das Touchpad
Das Touchpad
Power Button mit Fingerabdrucksensor
Eher subtile Hintergrundbeleuchtung

Display - Kontrastreiches Office-Panel mit weiteren Optionen

Kontraststarke Subpixel
Minimales Backlight Bleeding

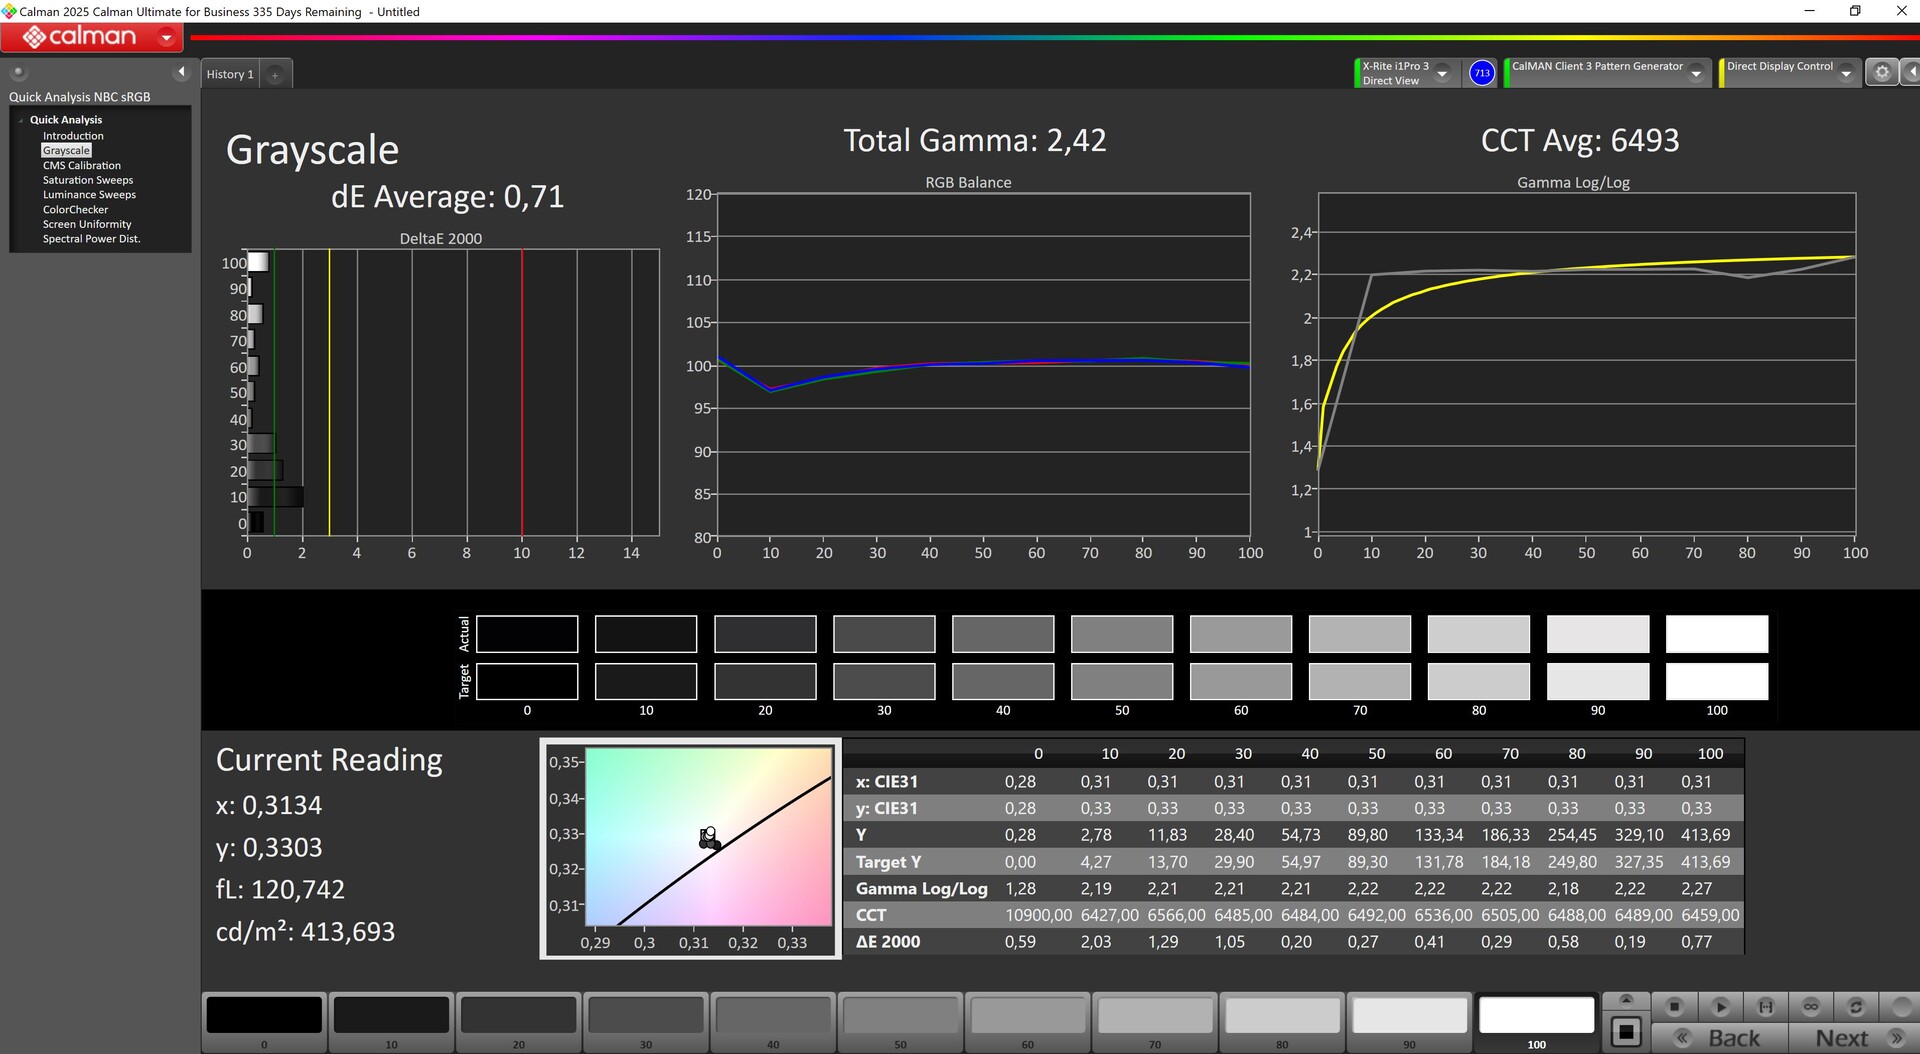
Beim Display gibt es mehrere Optionen. Wir haben ein mattes 1.920 x 1.200-Display in 16:10 mit offiziell 400 Nits und ohne Touch. Es gibt aber auch eines mit 300 Nits sowie die Top-Option mit 2.560 x 1.600 Pixeln, 500 Nits und Touchfunktion. Wichtig ist Dell dabei, dass alle Displays besonders energiesparend sein sollen.

Wir messen eine Durchschnittshelligkeit von 460 Nits bei einer guten Ausleuchtung. Auch der Kontrast ist durch den recht niedrigen Schwarzwert mehr als ordentlich. AdobeRGB und Display P3 werden zu etwa 75 Prozent abgedeckt, sRGB nahezu vollständig. 

Die Reaktionszeiten sind indes recht langsam und das Panel unterstützt nur 60 Hz. 

472
cd/m²
454
cd/m²
472
cd/m²
448
cd/m²
456
cd/m²
428
cd/m²
476
cd/m²
480
cd/m²
457
cd/m²
Ausleuchtung des Bildschirms
B133UAN (AUOBEB0) getestet mit X-Rite i1Pro 3
Maximal: 480 cd/m² (Nits) Durchschnitt: 460.3 cd/m² Minimum: 26.2 cd/m²
Ausleuchtung: 89 %
Helligkeit Akku: 456 cd/m²
Kontrast: 1983:1 (Schwarzwert: 0.23 cd/m²)
ΔE Color 3.3 | 0.5-29.43 Ø4.86, calibrated: 1.7
ΔE Greyscale 4.35 | 0.5-98 Ø5.1
75.9% AdobeRGB 1998 (Argyll 2.2.0 3D)
99.1% sRGB (Argyll 2.2.0 3D)
74.3% Display P3 (Argyll 2.2.0 3D)
Gamma: 2.51
Dell Pro 13 Premium PA13250
B133UAN (AUOBEB0), IPS, 1920x1200, 13.3", 60 Hz
MSI Prestige 13 AI Plus Evo A2VMG
ATNA33AA07-0, OLED, 2880x1800, 13.3", 60 Hz
Lenovo ThinkPad X13 2-in-1 Gen 5
Lenovo B133UAN01.2, IPS, 1920x1200, 13.3", 60 Hz
Framework Laptop 13.5 Core Ultra 7 155H
BOE NE135A1M-NY1, IPS, 2880x1920, 13.5", 120 Hz
Dell XPS 13 9350
LG Philips 134WU2, IPS, 1920x1200, 13.4", 120 Hz
Microsoft Surface Pro Copilot+
LP129WT342166, IPS, 2880x1920, 13", 120 Hz
Display
20%
-4%
-2%
-6%
6%
Display P3 Coverage
74.3
99.9
34%
71.1
-4%
72.8
-2%
67.3
-9%
83.4
12%
sRGB Coverage
99.1
100
1%
97.1
-2%
98.6
-1%
99
0%
99.7
1%
AdobeRGB 1998 Coverage
75.9
95.8
26%
71.7
-6%
72.9
-4%
68.6
-10%
79.4
5%
Response Times
94%
-9%
16%
16%
29%
Response Time Grey 50% / Grey 80% *
52.8 ?(23.4, 29.4)
1.94 ?(1, 0.94)
96%
50.2 ?(23.6, 26.6)
5%
41.9 ?(18.7, 23.2)
21%
37.3 ?(17, 20.3)
29%
39.6 ?(18.1, 21.5)
25%
Response Time Black / White *
26.4 ?(12.2, 14.2)
2.02 ?(0.92, 1.1)
92%
32.6 ?(18.2, 14.4)
-23%
23.7 ?(11.5, 12.2)
10%
25.9 ?(12.5, 13.4)
2%
18 ?(7, 11)
32%
PWM Frequency
60 ?(100)
Bildschirm
17%
-9%
-11%
31%
4%
Helligkeit Bildmitte
456
382.4
-16%
334
-27%
498.5
9%
462.8
1%
585
28%
Brightness
460
383
-17%
308
-33%
464
1%
435
-5%
574
25%
Brightness Distribution
89
99
11%
86
-3%
86
-3%
87
-2%
89
0%
Schwarzwert *
0.23
0.37
-61%
0.36
-57%
0.19
17%
0.56
-143%
Kontrast
1983
903
-54%
1385
-30%
2436
23%
1045
-47%
Delta E Colorchecker *
3.3
3.84
-16%
2.36
28%
4.27
-29%
1.92
42%
1.3
61%
Colorchecker dE 2000 max. *
6.47
6.66
-3%
4.93
24%
7.08
-9%
3.45
47%
3
54%
Colorchecker dE 2000 calibrated *
1.7
0.41
76%
1.25
26%
1.26
26%
0.48
72%
Delta E Graustufen *
4.35
0.7
84%
3.38
22%
4.7
-8%
0.6
86%
2
54%
Gamma
2.51 88%
2.23 99%
2.38 92%
2.09 105%
2.19 100%
2.18 101%
CCT
6215 105%
6475 100%
6352 102%
7417 88%
6539 99%
6914 94%
Durchschnitt gesamt (Programm / Settings)
44% / 31%
-7% / -8%
1% / -5%
14% / 21%
13% / 8%

* ... kleinere Werte sind besser

Ab Werk ist das Panel nicht sonderlich gut kalibriert, unsere manuelle Kalibrierung verbessert die DeltaE-Werte sowohl in den Graustufen als auch im ColorChecker, allerdings gibt es weiterhin einen Ausreißer im roten Bereich.

Graustufen
Graustufen
Sättigung
Sättigung
ColorChecker
ColorChecker
Graustufen kalibriert
Sättigung kalibriert
ColorChecker kalibriert

Reaktionszeiten (Response Times) des Displays

Die Reaktionszeiten (Response Times) beschreiben wie schnell zwischen zwei Farben eines Pixels umgeschaltet werden kann. Langsame Response Times können zu einer verschwommenen Darstellung, Schlieren und Geisterbilder führen. Besonders bei schnellen 3D-Spielen sind kurze Umschaltzeiten wichtig.
       Reaktionszeiten Schwarz zu Weiß
26.4 ms ... steigend ↗ und fallend ↘ kombiniert↗ 12.2 ms steigend
↘ 14.2 ms fallend
Die gemessenen Reaktionszeiten sind mittelmäßig und dadurch für Spieler eventuell zu langsam.
Im Vergleich rangierten die bei uns getesteten Geräte von 0.1 (Minimum) zu 240 (Maximum) ms. » 63 % aller Screens waren schneller als der getestete.
Daher sind die gemessenen Reaktionszeiten schlechter als der Durchschnitt aller vermessenen Geräte (20.7 ms).
       Reaktionszeiten 50% Grau zu 80% Grau
52.8 ms ... steigend ↗ und fallend ↘ kombiniert↗ 23.4 ms steigend
↘ 29.4 ms fallend
Die gemessenen Reaktionszeiten sind langsam und dadurch für viele Spieler wahrscheinlich zu langsam.
Im Vergleich rangierten die bei uns getesteten Geräte von 0.165 (Minimum) zu 636 (Maximum) ms. » 89 % aller Screens waren schneller als der getestete.
Daher sind die gemessenen Reaktionszeiten schlechter als der Durchschnitt aller vermessenen Geräte (32.4 ms).

Bildschirm-Flackern / PWM (Pulse-Width Modulation)

Eine günstige Methode um die Helligkeit eines Bildschirms zu steuern, ist die Beleuchtung periodisch ein- und auszuschalten. Dies nennt sich PWM (Pulsweitenmodulation) Diese Umschaltung sollte mit einer hohen Frequenz stattfinden damit das menschliche Auge kein Flimmern wahrnimmt. Wenn die Frequenz zu niedrig ist, kann dies zu Ermüdungserscheinungen, Augenbrennen, Kopfweh und auch sichtbaren Flackern führen.
Flackern / PWM nicht festgestellt

Im Vergleich: 53 % aller getesteten Geräte nutzten kein PWM um die Helligkeit zu reduzieren. Wenn PWM eingesetzt wurde, dann bei einer Frequenz von durchschnittlich 8458 (Minimum 5, Maximum 343500) Hz.

Helligkeit 0 %
Helligkeit 0 %
Helligkeit 25 %
Helligkeit 25 %
Helligkeit 50 %
Helligkeit 50 %
Helligkeit 75 %
Helligkeit 75 %
Helligkeit 100 %
Helligkeit 100 %

Im Freien ermöglichen die gute Helligkeit, der gute Kontrast, die matte Oberfläche sowie die gute Blickwinkelstabilität ein weitgehend problemloses Arbeiten.

Im Freien, direkte Draufsicht
Im Freien, schräger Blick

Leistung - Starke Arc 140V

Herzstück ist der neue Prozessor Intel Core Ultra 7 268V, dazu gibt es 32 GB fest verbauten RAM. Alternativ gibt es eine Version mit schwächerem Core Ultra 5 236V und 16 GB RAM. Auch der Massenspeicher ist in diversen Stufen (256 GB, 512 GB, 1 TB) verfügbar. Das Dell Pro 13 Premium richtet sich klar an mobile Business-User.

Testbedingungen

Dell Optimizer dient als Control Center, hier gibt es Lüftereinstellungen, die die Leistung beeinflussen und einige wenige andere Einstellungen. Für unsere Benchmarks haben wir es bei dem vorausgewählten Modus "Optimiert" belassen.

Homescreen Dell Command
Lüfterprofile
Lüfterprofile
Touchpad-Zusatzsymbole für Meetings
Automatische Updates lassen sich deaktivieren

Prozessor

Cinebench R23: Ultra-Leistung
Cinebench R23: Optimiert
Cinebench R23: Kühl
Cinebench R23: Kühl
Cinebench R23: Leise
Cinebench R23: Akku
Cinebench R23: Akku

Der Intel Core Ultra 7 268V ist eines der höheren Modelle der stromsparenden Lunar-Lake-Familie. Seine 4 E- und 4 P-Kerne takten von 2,2 GHz bis zu 5,0 GHz. Zudem ist eine NPU mit 48 TOPS verbaut.

Spitzenmäßig ist über alle Tests hinweg vor allem seine Single-Core-Leistung, in Multi-Core-Benchmarks enttäuscht die CPU im Dell Pro 13 etwas und liegt oft leicht hinter der Konkurrenz mit teils nominell schwächerem Prozessor. Im Akkumodus gehen etwa 16 Prozent an Leistung verloren.

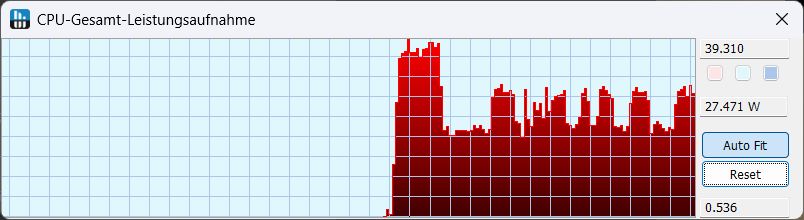
Im Cinebench-R15-Loop sinkt die Leistung innerhalb der ersten drei Durchgänge um etwa 28 Prozent (!) und bleibt danach konstant. Im Standardmodus Optimiert liegt die Leistungsaufnahme erst bei ca. 38 W und fällt danach auf 27 W. Die Bilder rechts zeigen das Leistungsaufnahmeverhalten in Cinebench R23 je nach Lüftermodus.

Cinebench R15 Multi Dauertest

012024036048060072084096010801200132014401560168018001920204021602280Tooltip
Dell Pro 13 Premium PA13250 Intel Core Ultra 7 268V: Ø1199 (1128.6-1600.9)
MSI Prestige 13 AI Plus Evo A2VMG Intel Core Ultra 7 258V: Ø1551 (1467.08-1624.89)
Lenovo ThinkPad X13 2-in-1 Gen 5 Intel Core Ultra 7 165U: Ø1064 (966.95-1428.42)
Framework Laptop 13.5 Core Ultra 7 155H Intel Core Ultra 7 155H: Ø1844 (1807.26-2336.72)
Dell XPS 13 9350 Intel Core Ultra 7 256V: Ø1415 (1369.16-1569.86)
Microsoft Surface Pro Copilot+ Qualcomm Snapdragon X Plus X1P-64-100: Ø1433 (1369.72-1988.86)
CPU Performance Rating: Percent
Cinebench R23: Multi Core | Single Core
Cinebench R20: CPU (Multi Core) | CPU (Single Core)
Cinebench R15: CPU Multi 64Bit | CPU Single 64Bit
Blender: v2.79 BMW27 CPU
7-Zip 18.03: 7z b 4 | 7z b 4 -mmt1
Geekbench 6.4: Multi-Core | Single-Core
Geekbench 5.5: Multi-Core | Single-Core
HWBOT x265 Benchmark v2.2: 4k Preset
LibreOffice : 20 Documents To PDF
R Benchmark 2.5: Overall mean
CPU Performance Rating
Framework Laptop 13.5 Core Ultra 7 155H
Intel Core Ultra 7 155H
81.6 pt
MSI Prestige 13 AI Plus Evo A2VMG
Intel Core Ultra 7 258V
75.8 pt
Durchschnittliche Intel Core Ultra 7 268V
 
75.3 pt
Dell XPS 13 9350
Intel Core Ultra 7 256V
74.5 pt
Durchschnitt der Klasse Subnotebook
 
74.5 pt
Dell Pro 13 Premium PA13250
Intel Core Ultra 7 268V
72 pt
Lenovo ThinkPad X13 2-in-1 Gen 5
Intel Core Ultra 7 165U
59.8 pt
Microsoft Surface Pro Copilot+ -2!
Qualcomm Snapdragon X Plus X1P-64-100
55.9 pt
Cinebench R23 / Multi Core
Framework Laptop 13.5 Core Ultra 7 155H
Intel Core Ultra 7 155H
13247 (11787.9min - 13246.9max) Points +35%
Durchschnitt der Klasse Subnotebook
  (1555 - 21812, n=73, der letzten 2 Jahre)
11705 Points +19%
MSI Prestige 13 AI Plus Evo A2VMG
Intel Core Ultra 7 258V
11097 (10572.3min - 11097.5max) Points +13%
Durchschnittliche Intel Core Ultra 7 268V
  (9835 - 10868, n=3)
10413 Points +6%
Dell XPS 13 9350
Intel Core Ultra 7 256V
10391 (9371.44min - 10390.8max) Points +6%
Dell Pro 13 Premium PA13250
Intel Core Ultra 7 268V
9835 Points
Microsoft Surface Pro Copilot+
Qualcomm Snapdragon X Plus X1P-64-100
8644 Points -12%
Lenovo ThinkPad X13 2-in-1 Gen 5
Intel Core Ultra 7 165U
8498 Points -14%
Cinebench R23 / Single Core
Dell Pro 13 Premium PA13250
Intel Core Ultra 7 268V
1985 Points
Durchschnittliche Intel Core Ultra 7 268V
  (1910 - 1985, n=3)
1939 Points -2%
Dell XPS 13 9350
Intel Core Ultra 7 256V
1875 Points -6%
MSI Prestige 13 AI Plus Evo A2VMG
Intel Core Ultra 7 258V
1843 Points -7%
Framework Laptop 13.5 Core Ultra 7 155H
Intel Core Ultra 7 155H
1757 Points -11%
Durchschnitt der Klasse Subnotebook
  (358 - 2165, n=73, der letzten 2 Jahre)
1687 Points -15%
Lenovo ThinkPad X13 2-in-1 Gen 5
Intel Core Ultra 7 165U
1507 Points -24%
Microsoft Surface Pro Copilot+
Qualcomm Snapdragon X Plus X1P-64-100
1129 Points -43%
Cinebench R20 / CPU (Multi Core)
Framework Laptop 13.5 Core Ultra 7 155H
Intel Core Ultra 7 155H
5160 Points +35%
Durchschnitt der Klasse Subnotebook
  (579 - 8541, n=68, der letzten 2 Jahre)
4546 Points +19%
MSI Prestige 13 AI Plus Evo A2VMG
Intel Core Ultra 7 258V
4284 Points +12%
Durchschnittliche Intel Core Ultra 7 268V
  (3811 - 4255, n=3)
4065 Points +7%
Dell XPS 13 9350
Intel Core Ultra 7 256V
4038 Points +6%
Dell Pro 13 Premium PA13250
Intel Core Ultra 7 268V
3811 Points
Lenovo ThinkPad X13 2-in-1 Gen 5
Intel Core Ultra 7 165U
3254 Points -15%
Microsoft Surface Pro Copilot+
Qualcomm Snapdragon X Plus X1P-64-100
3252 Points -15%
Cinebench R20 / CPU (Single Core)
Dell Pro 13 Premium PA13250
Intel Core Ultra 7 268V
764 Points
Durchschnittliche Intel Core Ultra 7 268V
  (736 - 764, n=3)
746 Points -2%
Dell XPS 13 9350
Intel Core Ultra 7 256V
720 Points -6%
MSI Prestige 13 AI Plus Evo A2VMG
Intel Core Ultra 7 258V
709 Points -7%
Framework Laptop 13.5 Core Ultra 7 155H
Intel Core Ultra 7 155H
669 Points -12%
Durchschnitt der Klasse Subnotebook
  (128 - 826, n=68, der letzten 2 Jahre)
640 Points -16%
Lenovo ThinkPad X13 2-in-1 Gen 5
Intel Core Ultra 7 165U
604 Points -21%
Microsoft Surface Pro Copilot+
Qualcomm Snapdragon X Plus X1P-64-100
420 Points -45%
Cinebench R15 / CPU Multi 64Bit
Framework Laptop 13.5 Core Ultra 7 155H
Intel Core Ultra 7 155H
2337 (1807.26min - 2336.72max) Points +46%
Microsoft Surface Pro Copilot+
Qualcomm Snapdragon X Plus X1P-64-100
1989 (1369.72min - 1988.86max) Points +24%
Durchschnitt der Klasse Subnotebook
  (327 - 3345, n=73, der letzten 2 Jahre)
1960 Points +22%
MSI Prestige 13 AI Plus Evo A2VMG
Intel Core Ultra 7 258V
1625 (1467.08min - 1624.89max) Points +1%
Durchschnittliche Intel Core Ultra 7 268V
  (1601 - 1651, n=3)
1623 Points +1%
Dell Pro 13 Premium PA13250
Intel Core Ultra 7 268V
1601 (1128.6min - 1600.9max) Points
Dell XPS 13 9350
Intel Core Ultra 7 256V
1570 (1369.16min - 1569.86max) Points -2%
Lenovo ThinkPad X13 2-in-1 Gen 5
Intel Core Ultra 7 165U
1428 (966.95min - 1428.42max) Points -11%
Cinebench R15 / CPU Single 64Bit
Dell Pro 13 Premium PA13250
Intel Core Ultra 7 268V
302 Points
Durchschnittliche Intel Core Ultra 7 268V
  (287 - 302, n=3)
296 Points -2%
Dell XPS 13 9350
Intel Core Ultra 7 256V
285 Points -6%
MSI Prestige 13 AI Plus Evo A2VMG
Intel Core Ultra 7 258V
281 Points -7%
Framework Laptop 13.5 Core Ultra 7 155H
Intel Core Ultra 7 155H
257 Points -15%
Durchschnitt der Klasse Subnotebook
  (72.4 - 322, n=69, der letzten 2 Jahre)
254 Points -16%
Lenovo ThinkPad X13 2-in-1 Gen 5
Intel Core Ultra 7 165U
220 Points -27%
Microsoft Surface Pro Copilot+
Qualcomm Snapdragon X Plus X1P-64-100
209 Points -31%
Blender / v2.79 BMW27 CPU
Dell Pro 13 Premium PA13250
Intel Core Ultra 7 268V
410 Seconds *
Microsoft Surface Pro Copilot+
Qualcomm Snapdragon X Plus X1P-64-100
402 Seconds * +2%
Lenovo ThinkPad X13 2-in-1 Gen 5
Intel Core Ultra 7 165U
380 Seconds * +7%
Durchschnitt der Klasse Subnotebook
  (159 - 2271, n=70, der letzten 2 Jahre)
376 Seconds * +8%
Durchschnittliche Intel Core Ultra 7 268V
  (337 - 410, n=3)
361 Seconds * +12%
Dell XPS 13 9350
Intel Core Ultra 7 256V
339 Seconds * +17%
MSI Prestige 13 AI Plus Evo A2VMG
Intel Core Ultra 7 258V
320 Seconds * +22%
Framework Laptop 13.5 Core Ultra 7 155H
Intel Core Ultra 7 155H
258 Seconds * +37%
7-Zip 18.03 / 7z b 4
Framework Laptop 13.5 Core Ultra 7 155H
Intel Core Ultra 7 155H
52680 MIPS +61%
Durchschnitt der Klasse Subnotebook
  (11668 - 77867, n=64, der letzten 2 Jahre)
46904 MIPS +43%
Microsoft Surface Pro Copilot+
Qualcomm Snapdragon X Plus X1P-64-100
37289 MIPS +14%
Dell XPS 13 9350
Intel Core Ultra 7 256V
35950 MIPS +10%
MSI Prestige 13 AI Plus Evo A2VMG
Intel Core Ultra 7 258V
35923 MIPS +10%
Durchschnittliche Intel Core Ultra 7 268V
  (32797 - 36610, n=3)
35031 MIPS +7%
Dell Pro 13 Premium PA13250
Intel Core Ultra 7 268V
32797 MIPS
Lenovo ThinkPad X13 2-in-1 Gen 5
Intel Core Ultra 7 165U
30898 MIPS -6%
7-Zip 18.03 / 7z b 4 -mmt1
Durchschnittliche Intel Core Ultra 7 268V
  (5884 - 6021, n=3)
5965 MIPS +1%
Dell Pro 13 Premium PA13250
Intel Core Ultra 7 268V
5884 MIPS
Dell XPS 13 9350
Intel Core Ultra 7 256V
5727 MIPS -3%
MSI Prestige 13 AI Plus Evo A2VMG
Intel Core Ultra 7 258V
5547 MIPS -6%
Durchschnitt der Klasse Subnotebook
  (2643 - 6442, n=66, der letzten 2 Jahre)
5473 MIPS -7%
Framework Laptop 13.5 Core Ultra 7 155H
Intel Core Ultra 7 155H
5355 MIPS -9%
Microsoft Surface Pro Copilot+
Qualcomm Snapdragon X Plus X1P-64-100
4652 MIPS -21%
Lenovo ThinkPad X13 2-in-1 Gen 5
Intel Core Ultra 7 165U
4644 MIPS -21%
Geekbench 6.4 / Multi-Core
Microsoft Surface Pro Copilot+
Qualcomm Snapdragon X Plus X1P-64-100
13278 Points +25%
Framework Laptop 13.5 Core Ultra 7 155H
Intel Core Ultra 7 155H
12027 Points +14%
Durchschnitt der Klasse Subnotebook
  (2244 - 17489, n=74, der letzten 2 Jahre)
11765 Points +11%
Durchschnittliche Intel Core Ultra 7 268V
  (10589 - 11388, n=4)
11042 Points +4%
MSI Prestige 13 AI Plus Evo A2VMG
Intel Core Ultra 7 258V
10978 Points +4%
Dell XPS 13 9350
Intel Core Ultra 7 256V
10972 Points +4%
Dell Pro 13 Premium PA13250
Intel Core Ultra 7 268V
10589 Points
Lenovo ThinkPad X13 2-in-1 Gen 5
Intel Core Ultra 7 165U
9308 Points -12%
Geekbench 6.4 / Single-Core
Dell Pro 13 Premium PA13250
Intel Core Ultra 7 268V
2809 Points
Durchschnittliche Intel Core Ultra 7 268V
  (2583 - 2871, n=4)
2780 Points -1%
Dell XPS 13 9350
Intel Core Ultra 7 256V
2778 Points -1%
MSI Prestige 13 AI Plus Evo A2VMG
Intel Core Ultra 7 258V
2723 Points -3%
Durchschnitt der Klasse Subnotebook
  (960 - 3820, n=69, der letzten 2 Jahre)
2577 Points -8%
Microsoft Surface Pro Copilot+
Qualcomm Snapdragon X Plus X1P-64-100
2445 Points -13%
Framework Laptop 13.5 Core Ultra 7 155H
Intel Core Ultra 7 155H
2414 Points -14%
Lenovo ThinkPad X13 2-in-1 Gen 5
Intel Core Ultra 7 165U
2275 Points -19%
Lenovo ThinkPad X13 2-in-1 Gen 5
Intel Core Ultra 7 165U
2092 Points -26%
Geekbench 5.5 / Multi-Core
Framework Laptop 13.5 Core Ultra 7 155H
Intel Core Ultra 7 155H
11409 Points +20%
Durchschnitt der Klasse Subnotebook
  (2557 - 17218, n=65, der letzten 2 Jahre)
10279 Points +8%
Durchschnittliche Intel Core Ultra 7 268V
  (9491 - 9855, n=4)
9728 Points +2%
MSI Prestige 13 AI Plus Evo A2VMG
Intel Core Ultra 7 258V
9657 Points +2%
Dell Pro 13 Premium PA13250
Intel Core Ultra 7 268V
9491 Points
Dell XPS 13 9350
Intel Core Ultra 7 256V
9302 Points -2%
Lenovo ThinkPad X13 2-in-1 Gen 5
Intel Core Ultra 7 165U
8028 Points -15%
Geekbench 5.5 / Single-Core
Durchschnittliche Intel Core Ultra 7 268V
  (2008 - 2097, n=4)
2051 Points +2%
Dell XPS 13 9350
Intel Core Ultra 7 256V
2010 Points 0%
Dell Pro 13 Premium PA13250
Intel Core Ultra 7 268V
2008 Points
MSI Prestige 13 AI Plus Evo A2VMG
Intel Core Ultra 7 258V
1977 Points -2%
Durchschnitt der Klasse Subnotebook
  (726 - 2350, n=65, der letzten 2 Jahre)
1832 Points -9%
Framework Laptop 13.5 Core Ultra 7 155H
Intel Core Ultra 7 155H
1753 Points -13%
Lenovo ThinkPad X13 2-in-1 Gen 5
Intel Core Ultra 7 165U
1714 Points -15%
HWBOT x265 Benchmark v2.2 / 4k Preset
MSI Prestige 13 AI Plus Evo A2VMG
Intel Core Ultra 7 258V
14.2 fps +37%
Framework Laptop 13.5 Core Ultra 7 155H
Intel Core Ultra 7 155H
14 fps +35%
Dell XPS 13 9350
Intel Core Ultra 7 256V
13.1 fps +26%
Durchschnitt der Klasse Subnotebook
  (0.97 - 25.1, n=67, der letzten 2 Jahre)
13 fps +25%
Durchschnittliche Intel Core Ultra 7 268V
  (10.4 - 12.9, n=3)
12.1 fps +16%
Dell Pro 13 Premium PA13250
Intel Core Ultra 7 268V
10.4 fps
Lenovo ThinkPad X13 2-in-1 Gen 5
Intel Core Ultra 7 165U
9.06 fps -13%
Microsoft Surface Pro Copilot+
Qualcomm Snapdragon X Plus X1P-64-100
6.54 fps -37%
LibreOffice / 20 Documents To PDF
Dell Pro 13 Premium PA13250
Intel Core Ultra 7 268V
60.8 s *
Microsoft Surface Pro Copilot+
Qualcomm Snapdragon X Plus X1P-64-100
58.3 s * +4%
Lenovo ThinkPad X13 2-in-1 Gen 5
Intel Core Ultra 7 165U
56.4 s * +7%
Durchschnitt der Klasse Subnotebook
  (38.5 - 220, n=65, der letzten 2 Jahre)
54.5 s * +10%
Dell XPS 13 9350
Intel Core Ultra 7 256V
53.2 s * +12%
Durchschnittliche Intel Core Ultra 7 268V
  (48 - 60.8, n=3)
52.4 s * +14%
MSI Prestige 13 AI Plus Evo A2VMG
Intel Core Ultra 7 258V
50.9 s * +16%
Framework Laptop 13.5 Core Ultra 7 155H
Intel Core Ultra 7 155H
47.9 s * +21%
R Benchmark 2.5 / Overall mean
Microsoft Surface Pro Copilot+
Qualcomm Snapdragon X Plus X1P-64-100
0.738 sec * -70%
Lenovo ThinkPad X13 2-in-1 Gen 5
Intel Core Ultra 7 165U
0.555 sec * -28%
Durchschnitt der Klasse Subnotebook
  (0.403 - 1.456, n=67, der letzten 2 Jahre)
0.527 sec * -21%
Framework Laptop 13.5 Core Ultra 7 155H
Intel Core Ultra 7 155H
0.4706 sec * -8%
MSI Prestige 13 AI Plus Evo A2VMG
Intel Core Ultra 7 258V
0.4599 sec * -6%
Dell XPS 13 9350
Intel Core Ultra 7 256V
0.4578 sec * -5%
Durchschnittliche Intel Core Ultra 7 268V
  (0.4344 - 0.4565, n=3)
0.4423 sec * -2%
Dell Pro 13 Premium PA13250
Intel Core Ultra 7 268V
0.4344 sec *

* ... kleinere Werte sind besser

Cinebench R15 CPU Multi 64Bit
1601 Points
Cinebench R15 OpenGL 64Bit
174.9 fps
Cinebench R15 Ref. Match 64Bit
97.8 %
Cinebench R15 CPU Single 64Bit
302 Points
Cinebench R20 CPU (Multi Core)
3811 Points
Cinebench R20 CPU (Single Core)
764 Points
Cinebench R23 Single Core
1985 Points
Cinebench R23 Multi Core
9835 Points
Hilfe
Performance Rating
Framework Laptop 13.5 Core Ultra 7 155H
Intel Core Ultra 7 155H, Arc 8-Core
93.5 pt
Durchschnitt der Klasse Subnotebook
 
92.1 pt
MSI Prestige 13 AI Plus Evo A2VMG
Intel Core Ultra 7 258V, Arc 140V
84.9 pt
Dell XPS 13 9350
Intel Core Ultra 7 256V, Arc 140V
81.3 pt
Durchschnittliche Intel Core Ultra 7 268V
 
77.3 pt
Dell Pro 13 Premium PA13250
Intel Core Ultra 7 268V, Arc 140V
69.6 pt
Lenovo ThinkPad X13 2-in-1 Gen 5
Intel Core Ultra 7 165U, Graphics 4-Core
56 pt
Microsoft Surface Pro Copilot+
Qualcomm Snapdragon X Plus X1P-64-100, Adreno X1-85 3.8 TFLOPS
54.9 pt
AIDA64 / FP32 Ray-Trace
Durchschnitt der Klasse Subnotebook
  (1135 - 32888, n=67, der letzten 2 Jahre)
13041 KRay/s +24%
MSI Prestige 13 AI Plus Evo A2VMG
Intel Core Ultra 7 258V, Arc 140V
12647 KRay/s +20%
Dell XPS 13 9350
Intel Core Ultra 7 256V, Arc 140V
12287 KRay/s +16%
Durchschnittliche Intel Core Ultra 7 268V
  (10556 - 12759, n=3)
11621 KRay/s +10%
Framework Laptop 13.5 Core Ultra 7 155H
Intel Core Ultra 7 155H, Arc 8-Core
11486 KRay/s +9%
Dell Pro 13 Premium PA13250
Intel Core Ultra 7 268V, Arc 140V
10556 KRay/s
Microsoft Surface Pro Copilot+
Qualcomm Snapdragon X Plus X1P-64-100, Adreno X1-85 3.8 TFLOPS
7637 KRay/s -28%
Lenovo ThinkPad X13 2-in-1 Gen 5
Intel Core Ultra 7 165U, Graphics 4-Core
6218 KRay/s -41%
AIDA64 / FPU Julia
MSI Prestige 13 AI Plus Evo A2VMG
Intel Core Ultra 7 258V, Arc 140V
63401 Points +33%
Dell XPS 13 9350
Intel Core Ultra 7 256V, Arc 140V
61131 Points +28%
Framework Laptop 13.5 Core Ultra 7 155H
Intel Core Ultra 7 155H, Arc 8-Core
59515 Points +25%
Durchschnitt der Klasse Subnotebook
  (5218 - 123315, n=67, der letzten 2 Jahre)
59191 Points +24%
Durchschnittliche Intel Core Ultra 7 268V
  (47659 - 62102, n=3)
55353 Points +16%
Dell Pro 13 Premium PA13250
Intel Core Ultra 7 268V, Arc 140V
47659 Points
Lenovo ThinkPad X13 2-in-1 Gen 5
Intel Core Ultra 7 165U, Graphics 4-Core
32054 Points -33%
Microsoft Surface Pro Copilot+
Qualcomm Snapdragon X Plus X1P-64-100, Adreno X1-85 3.8 TFLOPS
5315 Points -89%
AIDA64 / CPU SHA3
Durchschnitt der Klasse Subnotebook
  (444 - 5287, n=67, der letzten 2 Jahre)
2921 MB/s +38%
MSI Prestige 13 AI Plus Evo A2VMG
Intel Core Ultra 7 258V, Arc 140V
2798 MB/s +32%
Framework Laptop 13.5 Core Ultra 7 155H
Intel Core Ultra 7 155H, Arc 8-Core
2750 MB/s +30%
Dell XPS 13 9350
Intel Core Ultra 7 256V, Arc 140V
2713 MB/s +28%
Durchschnittliche Intel Core Ultra 7 268V
  (2117 - 2784, n=3)
2480 MB/s +17%
Dell Pro 13 Premium PA13250
Intel Core Ultra 7 268V, Arc 140V
2117 MB/s
Lenovo ThinkPad X13 2-in-1 Gen 5
Intel Core Ultra 7 165U, Graphics 4-Core
1739 MB/s -18%
Microsoft Surface Pro Copilot+
Qualcomm Snapdragon X Plus X1P-64-100, Adreno X1-85 3.8 TFLOPS
1668 MB/s -21%
AIDA64 / CPU Queen
Framework Laptop 13.5 Core Ultra 7 155H
Intel Core Ultra 7 155H, Arc 8-Core
86952 Points +75%
Durchschnitt der Klasse Subnotebook
  (10579 - 115682, n=67, der letzten 2 Jahre)
73372 Points +47%
Microsoft Surface Pro Copilot+
Qualcomm Snapdragon X Plus X1P-64-100, Adreno X1-85 3.8 TFLOPS
63513 Points +28%
MSI Prestige 13 AI Plus Evo A2VMG
Intel Core Ultra 7 258V, Arc 140V
49818 Points 0%
Dell Pro 13 Premium PA13250
Intel Core Ultra 7 268V, Arc 140V
49759 Points
Durchschnittliche Intel Core Ultra 7 268V
  (49630 - 49759, n=3)
49678 Points 0%
Dell XPS 13 9350
Intel Core Ultra 7 256V, Arc 140V
49622 Points 0%
Lenovo ThinkPad X13 2-in-1 Gen 5
Intel Core Ultra 7 165U, Graphics 4-Core
46055 Points -7%
AIDA64 / FPU SinJulia
Framework Laptop 13.5 Core Ultra 7 155H
Intel Core Ultra 7 155H, Arc 8-Core
8348 Points +92%
Durchschnitt der Klasse Subnotebook
  (744 - 18418, n=67, der letzten 2 Jahre)
7339 Points +69%
Lenovo ThinkPad X13 2-in-1 Gen 5
Intel Core Ultra 7 165U, Graphics 4-Core
4547 Points +4%
Dell XPS 13 9350
Intel Core Ultra 7 256V, Arc 140V
4428 Points +2%
MSI Prestige 13 AI Plus Evo A2VMG
Intel Core Ultra 7 258V, Arc 140V
4422 Points +2%
Durchschnittliche Intel Core Ultra 7 268V
  (4353 - 4429, n=3)
4403 Points +1%
Dell Pro 13 Premium PA13250
Intel Core Ultra 7 268V, Arc 140V
4353 Points
Microsoft Surface Pro Copilot+
Qualcomm Snapdragon X Plus X1P-64-100, Adreno X1-85 3.8 TFLOPS
1969 Points -55%
AIDA64 / FPU Mandel
MSI Prestige 13 AI Plus Evo A2VMG
Intel Core Ultra 7 258V, Arc 140V
33565 Points +29%
Dell XPS 13 9350
Intel Core Ultra 7 256V, Arc 140V
32410 Points +25%
Durchschnitt der Klasse Subnotebook
  (3341 - 65433, n=67, der letzten 2 Jahre)
30876 Points +19%
Framework Laptop 13.5 Core Ultra 7 155H
Intel Core Ultra 7 155H, Arc 8-Core
29439 Points +14%
Durchschnittliche Intel Core Ultra 7 268V
  (25929 - 31836, n=3)
29134 Points +12%
Dell Pro 13 Premium PA13250
Intel Core Ultra 7 268V, Arc 140V
25929 Points
Lenovo ThinkPad X13 2-in-1 Gen 5
Intel Core Ultra 7 165U, Graphics 4-Core
15677 Points -40%
Microsoft Surface Pro Copilot+
Qualcomm Snapdragon X Plus X1P-64-100, Adreno X1-85 3.8 TFLOPS
13050 Points -50%
AIDA64 / CPU AES
Framework Laptop 13.5 Core Ultra 7 155H
Intel Core Ultra 7 155H, Arc 8-Core
59475 MB/s +79%
Microsoft Surface Pro Copilot+
Qualcomm Snapdragon X Plus X1P-64-100, Adreno X1-85 3.8 TFLOPS
58675 MB/s +77%
Durchschnitt der Klasse Subnotebook
  (638 - 161430, n=67, der letzten 2 Jahre)
56526 MB/s +70%
Dell XPS 13 9350
Intel Core Ultra 7 256V, Arc 140V
40828 MB/s +23%
MSI Prestige 13 AI Plus Evo A2VMG
Intel Core Ultra 7 258V, Arc 140V
40649 MB/s +22%
Durchschnittliche Intel Core Ultra 7 268V
  (33196 - 38941, n=3)
36948 MB/s +11%
Lenovo ThinkPad X13 2-in-1 Gen 5
Intel Core Ultra 7 165U, Graphics 4-Core
36912 MB/s +11%
Dell Pro 13 Premium PA13250
Intel Core Ultra 7 268V, Arc 140V
33196 MB/s
AIDA64 / CPU ZLib
Framework Laptop 13.5 Core Ultra 7 155H
Intel Core Ultra 7 155H, Arc 8-Core
813 MB/s +84%
Durchschnitt der Klasse Subnotebook
  (164.9 - 1379, n=67, der letzten 2 Jahre)
737 MB/s +67%
Microsoft Surface Pro Copilot+
Qualcomm Snapdragon X Plus X1P-64-100, Adreno X1-85 3.8 TFLOPS
678 MB/s +54%
MSI Prestige 13 AI Plus Evo A2VMG
Intel Core Ultra 7 258V, Arc 140V
632 MB/s +43%
Durchschnittliche Intel Core Ultra 7 268V
  (441 - 631, n=3)
552 MB/s +25%
Dell XPS 13 9350
Intel Core Ultra 7 256V, Arc 140V
536 MB/s +22%
Lenovo ThinkPad X13 2-in-1 Gen 5
Intel Core Ultra 7 165U, Graphics 4-Core
518 MB/s +17%
Dell Pro 13 Premium PA13250
Intel Core Ultra 7 268V, Arc 140V
441 MB/s
AIDA64 / FP64 Ray-Trace
MSI Prestige 13 AI Plus Evo A2VMG
Intel Core Ultra 7 258V, Arc 140V
6930 KRay/s +17%
Durchschnitt der Klasse Subnotebook
  (610 - 17495, n=67, der letzten 2 Jahre)
6911 KRay/s +16%
Dell XPS 13 9350
Intel Core Ultra 7 256V, Arc 140V
6506 KRay/s +10%
Durchschnittliche Intel Core Ultra 7 268V
  (5938 - 6803, n=3)
6318 KRay/s +6%
Framework Laptop 13.5 Core Ultra 7 155H
Intel Core Ultra 7 155H, Arc 8-Core
5989 KRay/s +1%
Dell Pro 13 Premium PA13250
Intel Core Ultra 7 268V, Arc 140V
5938 KRay/s
Lenovo ThinkPad X13 2-in-1 Gen 5
Intel Core Ultra 7 165U, Graphics 4-Core
3182 KRay/s -46%
Microsoft Surface Pro Copilot+
Qualcomm Snapdragon X Plus X1P-64-100, Adreno X1-85 3.8 TFLOPS
2826 KRay/s -52%
AIDA64 / CPU PhotoWorxx
MSI Prestige 13 AI Plus Evo A2VMG
Intel Core Ultra 7 258V, Arc 140V
54881 MPixel/s +17%
Dell XPS 13 9350
Intel Core Ultra 7 256V, Arc 140V
51767 MPixel/s +11%
Durchschnittliche Intel Core Ultra 7 268V
  (46733 - 54886, n=3)
51720 MPixel/s +11%
Dell Pro 13 Premium PA13250
Intel Core Ultra 7 268V, Arc 140V
46733 MPixel/s
Framework Laptop 13.5 Core Ultra 7 155H
Intel Core Ultra 7 155H, Arc 8-Core
46620 MPixel/s 0%
Durchschnitt der Klasse Subnotebook
  (6569 - 64588, n=67, der letzten 2 Jahre)
42689 MPixel/s -9%
Lenovo ThinkPad X13 2-in-1 Gen 5
Intel Core Ultra 7 165U, Graphics 4-Core
41747 MPixel/s -11%
Microsoft Surface Pro Copilot+
Qualcomm Snapdragon X Plus X1P-64-100, Adreno X1-85 3.8 TFLOPS
36689 MPixel/s -21%

System Performance

Im PCMark 10 und im CrossMark liegen die Vergleichsgeräte nahe beieinander, aber sowohl hier als auch in den Webtests reiht sich unser Dell Pro eher mittig ein, als auf die Leistungsspitze zu zielen.

PCMark 10
PCMark 10
PCMark 10 / Score
Durchschnittliche Intel Core Ultra 7 268V, Intel Arc Graphics 140V
  (6729 - 7236, n=3)
6963 Points +3%
Dell XPS 13 9350
Arc 140V, Core Ultra 7 256V, Micron 2550 512GB
6955 Points +3%
Framework Laptop 13.5 Core Ultra 7 155H
Arc 8-Core, Ultra 7 155H
6853 Points +2%
MSI Prestige 13 AI Plus Evo A2VMG
Arc 140V, Core Ultra 7 258V
6812 Points +1%
Dell Pro 13 Premium PA13250
Arc 140V, Core Ultra 7 268V, Micron 2550 1TB
6729 Points
Durchschnitt der Klasse Subnotebook
  (4993 - 7788, n=56, der letzten 2 Jahre)
6573 Points -2%
Lenovo ThinkPad X13 2-in-1 Gen 5
Graphics 4-Core, Ultra 7 165U, Lenovo UMIS RPETJ1T24MHP2QDQ
5928 Points -12%
PCMark 10 / Essentials
Lenovo ThinkPad X13 2-in-1 Gen 5
Graphics 4-Core, Ultra 7 165U, Lenovo UMIS RPETJ1T24MHP2QDQ
11224 Points +12%
Framework Laptop 13.5 Core Ultra 7 155H
Arc 8-Core, Ultra 7 155H
10692 Points +7%
Durchschnitt der Klasse Subnotebook
  (9363 - 11331, n=56, der letzten 2 Jahre)
10479 Points +5%
Durchschnittliche Intel Core Ultra 7 268V, Intel Arc Graphics 140V
  (10007 - 10701, n=3)
10353 Points +3%
MSI Prestige 13 AI Plus Evo A2VMG
Arc 140V, Core Ultra 7 258V
10156 Points +1%
Dell Pro 13 Premium PA13250
Arc 140V, Core Ultra 7 268V, Micron 2550 1TB
10007 Points
Dell XPS 13 9350
Arc 140V, Core Ultra 7 256V, Micron 2550 512GB
10006 Points 0%
PCMark 10 / Productivity
Dell XPS 13 9350
Arc 140V, Core Ultra 7 256V, Micron 2550 512GB
9219 Points +5%
Durchschnittliche Intel Core Ultra 7 268V, Intel Arc Graphics 140V
  (8766 - 9217, n=3)
8935 Points +2%
Dell Pro 13 Premium PA13250
Arc 140V, Core Ultra 7 268V, Micron 2550 1TB
8766 Points
Durchschnitt der Klasse Subnotebook
  (5435 - 10623, n=56, der letzten 2 Jahre)
8675 Points -1%
Framework Laptop 13.5 Core Ultra 7 155H
Arc 8-Core, Ultra 7 155H
8633 Points -2%
MSI Prestige 13 AI Plus Evo A2VMG
Arc 140V, Core Ultra 7 258V
8478 Points -3%
Lenovo ThinkPad X13 2-in-1 Gen 5
Graphics 4-Core, Ultra 7 165U, Lenovo UMIS RPETJ1T24MHP2QDQ
8088 Points -8%
PCMark 10 / Digital Content Creation
MSI Prestige 13 AI Plus Evo A2VMG
Arc 140V, Core Ultra 7 258V
9967 Points +6%
Durchschnittliche Intel Core Ultra 7 268V, Intel Arc Graphics 140V
  (9425 - 10427, n=3)
9905 Points +5%
Dell XPS 13 9350
Arc 140V, Core Ultra 7 256V, Micron 2550 512GB
9898 Points +5%
Framework Laptop 13.5 Core Ultra 7 155H
Arc 8-Core, Ultra 7 155H
9465 Points 0%
Dell Pro 13 Premium PA13250
Arc 140V, Core Ultra 7 268V, Micron 2550 1TB
9425 Points
Durchschnitt der Klasse Subnotebook
  (5305 - 12442, n=56, der letzten 2 Jahre)
8571 Points -9%
Lenovo ThinkPad X13 2-in-1 Gen 5
Graphics 4-Core, Ultra 7 165U, Lenovo UMIS RPETJ1T24MHP2QDQ
6229 Points -34%
CrossMark / Overall
Dell XPS 13 9350
Arc 140V, Core Ultra 7 256V, Micron 2550 512GB
1736 Points +6%
MSI Prestige 13 AI Plus Evo A2VMG
Arc 140V, Core Ultra 7 258V
1717 Points +5%
Durchschnittliche Intel Core Ultra 7 268V, Intel Arc Graphics 140V
  (1643 - 1763, n=3)
1715 Points +4%
Framework Laptop 13.5 Core Ultra 7 155H
Arc 8-Core, Ultra 7 155H
1686 Points +3%
Dell Pro 13 Premium PA13250
Arc 140V, Core Ultra 7 268V, Micron 2550 1TB
1643 Points
Durchschnitt der Klasse Subnotebook
  (365 - 2038, n=66, der letzten 2 Jahre)
1598 Points -3%
Lenovo ThinkPad X13 2-in-1 Gen 5
Graphics 4-Core, Ultra 7 165U, Lenovo UMIS RPETJ1T24MHP2QDQ
1570 Points -4%
Microsoft Surface Pro Copilot+
Adreno X1-85 3.8 TFLOPS, SD X Plus X1P-64-100, Samsung PM9B1 256GB MZ9L4256HCJQ
1216 Points -26%
CrossMark / Productivity
Dell XPS 13 9350
Arc 140V, Core Ultra 7 256V, Micron 2550 512GB
1682 Points +7%
Durchschnittliche Intel Core Ultra 7 268V, Intel Arc Graphics 140V
  (1577 - 1696, n=3)
1651 Points +5%
MSI Prestige 13 AI Plus Evo A2VMG
Arc 140V, Core Ultra 7 258V
1646 Points +4%
Framework Laptop 13.5 Core Ultra 7 155H
Arc 8-Core, Ultra 7 155H
1607 Points +2%
Dell Pro 13 Premium PA13250
Arc 140V, Core Ultra 7 268V, Micron 2550 1TB
1577 Points
Lenovo ThinkPad X13 2-in-1 Gen 5
Graphics 4-Core, Ultra 7 165U, Lenovo UMIS RPETJ1T24MHP2QDQ
1571 Points 0%
Durchschnitt der Klasse Subnotebook
  (364 - 1918, n=66, der letzten 2 Jahre)
1531 Points -3%
Microsoft Surface Pro Copilot+
Adreno X1-85 3.8 TFLOPS, SD X Plus X1P-64-100, Samsung PM9B1 256GB MZ9L4256HCJQ
1124 Points -29%
CrossMark / Creativity
MSI Prestige 13 AI Plus Evo A2VMG
Arc 140V, Core Ultra 7 258V
1959 Points +5%
Durchschnittliche Intel Core Ultra 7 268V, Intel Arc Graphics 140V
  (1866 - 2021, n=3)
1954 Points +5%
Dell XPS 13 9350
Arc 140V, Core Ultra 7 256V, Micron 2550 512GB
1953 Points +5%
Framework Laptop 13.5 Core Ultra 7 155H
Arc 8-Core, Ultra 7 155H
1904 Points +2%
Dell Pro 13 Premium PA13250
Arc 140V, Core Ultra 7 268V, Micron 2550 1TB
1866 Points
Durchschnitt der Klasse Subnotebook
  (372 - 2396, n=66, der letzten 2 Jahre)
1772 Points -5%
Lenovo ThinkPad X13 2-in-1 Gen 5
Graphics 4-Core, Ultra 7 165U, Lenovo UMIS RPETJ1T24MHP2QDQ
1579 Points -15%
Microsoft Surface Pro Copilot+
Adreno X1-85 3.8 TFLOPS, SD X Plus X1P-64-100, Samsung PM9B1 256GB MZ9L4256HCJQ
1381 Points -26%
CrossMark / Responsiveness
Lenovo ThinkPad X13 2-in-1 Gen 5
Graphics 4-Core, Ultra 7 165U, Lenovo UMIS RPETJ1T24MHP2QDQ
1538 Points +21%
Framework Laptop 13.5 Core Ultra 7 155H
Arc 8-Core, Ultra 7 155H
1351 Points +7%
Durchschnitt der Klasse Subnotebook
  (312 - 1899, n=66, der letzten 2 Jahre)
1348 Points +6%
Dell XPS 13 9350
Arc 140V, Core Ultra 7 256V, Micron 2550 512GB
1343 Points +6%
MSI Prestige 13 AI Plus Evo A2VMG
Arc 140V, Core Ultra 7 258V
1311 Points +3%
Durchschnittliche Intel Core Ultra 7 268V, Intel Arc Graphics 140V
  (1267 - 1313, n=3)
1297 Points +2%
Dell Pro 13 Premium PA13250
Arc 140V, Core Ultra 7 268V, Micron 2550 1TB
1267 Points
Microsoft Surface Pro Copilot+
Adreno X1-85 3.8 TFLOPS, SD X Plus X1P-64-100, Samsung PM9B1 256GB MZ9L4256HCJQ
1052 Points -17%
WebXPRT 3 / Overall
Microsoft Surface Pro Copilot+
Adreno X1-85 3.8 TFLOPS, SD X Plus X1P-64-100, Samsung PM9B1 256GB MZ9L4256HCJQ
399 Points +50%
Durchschnitt der Klasse Subnotebook
  (156 - 482, n=65, der letzten 2 Jahre)
316 Points +19%
Dell XPS 13 9350
Arc 140V, Core Ultra 7 256V, Micron 2550 512GB
310 Points +17%
MSI Prestige 13 AI Plus Evo A2VMG
Arc 140V, Core Ultra 7 258V
303 Points +14%
Durchschnittliche Intel Core Ultra 7 268V, Intel Arc Graphics 140V
  (266 - 310, n=3)
289 Points +9%
Framework Laptop 13.5 Core Ultra 7 155H
Arc 8-Core, Ultra 7 155H
288 Points +8%
Dell Pro 13 Premium PA13250
Arc 140V, Core Ultra 7 268V, Micron 2550 1TB
266 Points
Lenovo ThinkPad X13 2-in-1 Gen 5
Graphics 4-Core, Ultra 7 165U, Lenovo UMIS RPETJ1T24MHP2QDQ
261 Points -2%
WebXPRT 4 / Overall
MSI Prestige 13 AI Plus Evo A2VMG
Arc 140V, Core Ultra 7 258V
287 Points +17%
Dell XPS 13 9350
Arc 140V, Core Ultra 7 256V, Micron 2550 512GB
286 Points +17%
Durchschnittliche Intel Core Ultra 7 268V, Intel Arc Graphics 140V
  (245 - 287, n=3)
270 Points +10%
Durchschnitt der Klasse Subnotebook
  (132 - 348, n=66, der letzten 2 Jahre)
265 Points +8%
Microsoft Surface Pro Copilot+
Adreno X1-85 3.8 TFLOPS, SD X Plus X1P-64-100, Samsung PM9B1 256GB MZ9L4256HCJQ
256 Points +4%
Framework Laptop 13.5 Core Ultra 7 155H
Arc 8-Core, Ultra 7 155H
255 Points +4%
Dell Pro 13 Premium PA13250
Arc 140V, Core Ultra 7 268V, Micron 2550 1TB
245 Points
Lenovo ThinkPad X13 2-in-1 Gen 5
Graphics 4-Core, Ultra 7 165U, Lenovo UMIS RPETJ1T24MHP2QDQ
244 Points 0%
Mozilla Kraken 1.1 / Total
Lenovo ThinkPad X13 2-in-1 Gen 5
Graphics 4-Core, Ultra 7 165U, Lenovo UMIS RPETJ1T24MHP2QDQ
541 ms * -14%
Framework Laptop 13.5 Core Ultra 7 155H
Arc 8-Core, Ultra 7 155H
532 ms * -12%
Durchschnitt der Klasse Subnotebook
  (265 - 1104, n=74, der letzten 2 Jahre)
505 ms * -6%
Dell Pro 13 Premium PA13250
Arc 140V, Core Ultra 7 268V, Micron 2550 1TB
476 ms *
MSI Prestige 13 AI Plus Evo A2VMG
Arc 140V, Core Ultra 7 258V
473 ms * +1%
Durchschnittliche Intel Core Ultra 7 268V, Intel Arc Graphics 140V
  (468 - 476, n=3)
473 ms * +1%
Dell XPS 13 9350
Arc 140V, Core Ultra 7 256V, Micron 2550 512GB
472 ms * +1%
Microsoft Surface Pro Copilot+
Adreno X1-85 3.8 TFLOPS, SD X Plus X1P-64-100, Samsung PM9B1 256GB MZ9L4256HCJQ
460.8 ms * +3%

* ... kleinere Werte sind besser

PCMark 10 Score
6729 Punkte
Hilfe
AIDA64 / Memory Copy
MSI Prestige 13 AI Plus Evo A2VMG
Intel Core Ultra 7 258V, Arc 140V
108474 MB/s +8%
Durchschnittliche Intel Core Ultra 7 268V
  (100445 - 108317, n=3)
105290 MB/s +5%
Dell XPS 13 9350
Intel Core Ultra 7 256V, Arc 140V
101642 MB/s +1%
Dell Pro 13 Premium PA13250
Intel Core Ultra 7 268V, Arc 140V
100445 MB/s
Durchschnitt der Klasse Subnotebook
  (14554 - 109035, n=67, der letzten 2 Jahre)
77035 MB/s -23%
Framework Laptop 13.5 Core Ultra 7 155H
Intel Core Ultra 7 155H, Arc 8-Core
75020 MB/s -25%
Lenovo ThinkPad X13 2-in-1 Gen 5
Intel Core Ultra 7 165U, Graphics 4-Core
73184 MB/s -27%
Microsoft Surface Pro Copilot+
Qualcomm Snapdragon X Plus X1P-64-100, Adreno X1-85 3.8 TFLOPS
63769 MB/s -37%
AIDA64 / Memory Read
Microsoft Surface Pro Copilot+
Qualcomm Snapdragon X Plus X1P-64-100, Adreno X1-85 3.8 TFLOPS
124555 MB/s +51%
Dell XPS 13 9350
Intel Core Ultra 7 256V, Arc 140V
88013 MB/s +7%
MSI Prestige 13 AI Plus Evo A2VMG
Intel Core Ultra 7 258V, Arc 140V
86537 MB/s +5%
Durchschnittliche Intel Core Ultra 7 268V
  (82511 - 88341, n=3)
86200 MB/s +4%
Dell Pro 13 Premium PA13250
Intel Core Ultra 7 268V, Arc 140V
82511 MB/s
Framework Laptop 13.5 Core Ultra 7 155H
Intel Core Ultra 7 155H, Arc 8-Core
80746 MB/s -2%
Durchschnitt der Klasse Subnotebook
  (15948 - 122210, n=67, der letzten 2 Jahre)
73592 MB/s -11%
Lenovo ThinkPad X13 2-in-1 Gen 5
Intel Core Ultra 7 165U, Graphics 4-Core
52264 MB/s -37%
AIDA64 / Memory Write
MSI Prestige 13 AI Plus Evo A2VMG
Intel Core Ultra 7 258V, Arc 140V
117897 MB/s +2%
Durchschnittliche Intel Core Ultra 7 268V
  (115959 - 117888, n=3)
117235 MB/s +1%
Dell Pro 13 Premium PA13250
Intel Core Ultra 7 268V, Arc 140V
115959 MB/s
Dell XPS 13 9350
Intel Core Ultra 7 256V, Arc 140V
112340 MB/s -3%
Durchschnitt der Klasse Subnotebook
  (15709 - 117898, n=67, der letzten 2 Jahre)
80299 MB/s -31%
Framework Laptop 13.5 Core Ultra 7 155H
Intel Core Ultra 7 155H, Arc 8-Core
72451 MB/s -38%
Lenovo ThinkPad X13 2-in-1 Gen 5
Intel Core Ultra 7 165U, Graphics 4-Core
62609 MB/s -46%
Microsoft Surface Pro Copilot+
Qualcomm Snapdragon X Plus X1P-64-100, Adreno X1-85 3.8 TFLOPS
45097 MB/s -61%
AIDA64 / Memory Latency
Lenovo ThinkPad X13 2-in-1 Gen 5
Intel Core Ultra 7 165U, Graphics 4-Core
143.6 ns * -42%
Framework Laptop 13.5 Core Ultra 7 155H
Intel Core Ultra 7 155H, Arc 8-Core
122 ns * -21%
Durchschnitt der Klasse Subnotebook
  (7.2 - 187.8, n=66, der letzten 2 Jahre)
104.2 ns * -3%
Dell Pro 13 Premium PA13250
Intel Core Ultra 7 268V, Arc 140V
101.2 ns *
MSI Prestige 13 AI Plus Evo A2VMG
Intel Core Ultra 7 258V, Arc 140V
101.1 ns * -0%
Dell XPS 13 9350
Intel Core Ultra 7 256V, Arc 140V
99.6 ns * +2%
Durchschnittliche Intel Core Ultra 7 268V
  (94.4 - 101.2, n=3)
97.7 ns * +3%
Microsoft Surface Pro Copilot+
Qualcomm Snapdragon X Plus X1P-64-100, Adreno X1-85 3.8 TFLOPS
7.5 ns * +93%

* ... kleinere Werte sind besser

DPC-Latenzen

Erste ernsthafte Latenzen stellen sich beim Öffnen mehrerer Browsertabs ein. Der Latenzwert erhöht sich bei der Wiedergabe unseres 4K/60-fps-YouTubevideos, das glücklicherweise dennoch ohne Dropped Frames abgespielt wird. Der Endwert ist uns etwas zu hoch.

YouTube-Test
YouTube-Test
LatencyMon Main
LatencyMon Main
LatencyMon Treiber
LatencyMon Treiber
DPC Latencies / LatencyMon - interrupt to process latency (max), Web, Youtube, Prime95
Dell Pro 13 Premium PA13250
Arc 140V, Core Ultra 7 268V, Micron 2550 1TB
1442.4 μs *
Lenovo ThinkPad X13 2-in-1 Gen 5
Graphics 4-Core, Ultra 7 165U, Lenovo UMIS RPETJ1T24MHP2QDQ
1202 μs * +17%
MSI Prestige 13 AI Plus Evo A2VMG
Arc 140V, Core Ultra 7 258V
816.4 μs * +43%
Framework Laptop 13.5 Core Ultra 7 155H
Arc 8-Core, Ultra 7 155H
665.5 μs * +54%

* ... kleinere Werte sind besser

Massenspeicher

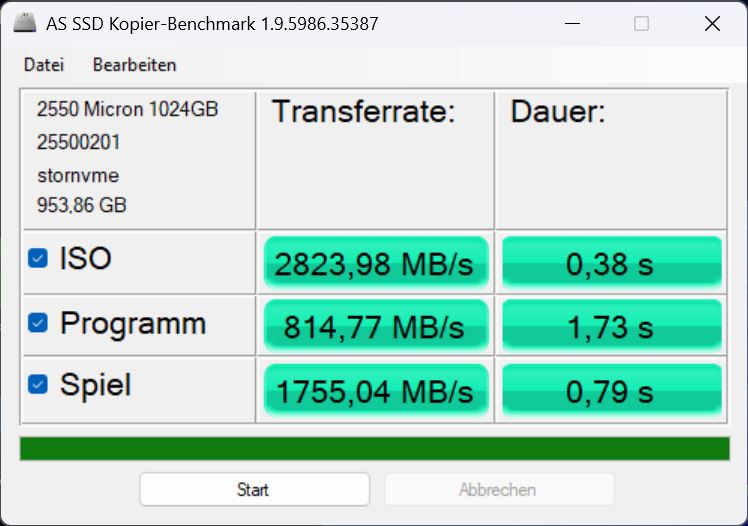
Update 05.05.2025: Als Massenspeicher dient eine Micron 2550 mit 1 TB, je nach Konfiguration findet man auch Modelle mit 512 GB. In unseren ersten Messungen enttäuschte das Laufwerk, offenbar störten Hintergrundprozesse den Vorgang. Unsere neuen Messungen fördern gute Geschwindigkeitswerte zutage, die Leistung liegt auf Erwartungsniveau.

Crystaldiskmark 6
Crystaldiskmark 6
AS SSD
AS SSD
AS SSD Copy
AS SSD Copy
Micron 2550 1TB
CDM 5/6 Read Seq Q32T1: 5167 MB/s
CDM 5/6 Write Seq Q32T1: 4516 MB/s
CDM 5/6 Read 4K Q32T1: 487 MB/s
CDM 5/6 Write 4K Q32T1: 457 MB/s
CDM 5/6 Read 4K: 55.9 MB/s
CDM 5/6 Write 4K: 154.6 MB/s
CDM 6 Write 4K Q8T8: 486 MB/s
CDM 6 Read 4K Q8T8: 714 MB/s
Drive Performance Rating - Percent
Lenovo ThinkPad X13 2-in-1 Gen 5
Lenovo UMIS RPETJ1T24MHP2QDQ
86.2 pt
Framework Laptop 13.5 Core Ultra 7 155H
 
70.6 pt
Durchschnitt der Klasse Subnotebook
 
63.4 pt
Durchschnittliche Micron 2550 1TB
 
61.5 pt
Dell Pro 13 Premium PA13250
Micron 2550 1TB
59.6 pt
MSI Prestige 13 AI Plus Evo A2VMG
 
55.9 pt
Microsoft Surface Pro Copilot+
Samsung PM9B1 256GB MZ9L4256HCJQ
51.5 pt
Dell XPS 13 9350
Micron 2550 512GB
49.4 pt
DiskSpd
seq read
Lenovo ThinkPad X13 2-in-1 Gen 5
Lenovo UMIS RPETJ1T24MHP2QDQ
4714 (4698.67min - 4714.19max) MB/s +76%
Framework Laptop 13.5 Core Ultra 7 155H
 
4012 (4000.53min - 4012.27max) MB/s +50%
Durchschnitt der Klasse Subnotebook
  (688 - 4852, n=66, der letzten 2 Jahre)
2974 MB/s +11%
Dell Pro 13 Premium PA13250
Micron 2550 1TB
2672 (2651.28min - 2672.4max) MB/s
Durchschnittliche Micron 2550 1TB
  (2165 - 2799, n=5)
2639 MB/s -1%
MSI Prestige 13 AI Plus Evo A2VMG
 
2513 (2459.65min - 2513.23max) MB/s -6%
Microsoft Surface Pro Copilot+
Samsung PM9B1 256GB MZ9L4256HCJQ
2451 (2391.59min - 2451.07max) MB/s -8%
Dell XPS 13 9350
Micron 2550 512GB
2416 (2299.74min - 2415.91max) MB/s -10%
seq write
Lenovo ThinkPad X13 2-in-1 Gen 5
Lenovo UMIS RPETJ1T24MHP2QDQ
5301 (5277.9min - 5301.39max) MB/s +99%
Framework Laptop 13.5 Core Ultra 7 155H
 
3701 (3556.54min - 3701.05max) MB/s +39%
Durchschnittliche Micron 2550 1TB
  (2658 - 3470, n=5)
3173 MB/s +19%
Durchschnitt der Klasse Subnotebook
  (102.8 - 5344, n=66, der letzten 2 Jahre)
2932 MB/s +10%
Dell Pro 13 Premium PA13250
Micron 2550 1TB
2658 (2406.9min - 2658.14max) MB/s
MSI Prestige 13 AI Plus Evo A2VMG
 
2590 (2240.31min - 2590.4max) MB/s -3%
Dell XPS 13 9350
Micron 2550 512GB
2477 (2281.75min - 2476.53max) MB/s -7%
Microsoft Surface Pro Copilot+
Samsung PM9B1 256GB MZ9L4256HCJQ
1920 (1853.32min - 1920.15max) MB/s -28%
seq q8 t1 read
Lenovo ThinkPad X13 2-in-1 Gen 5
Lenovo UMIS RPETJ1T24MHP2QDQ
7056 (6353.03min - 7056.44max) MB/s +37%
Framework Laptop 13.5 Core Ultra 7 155H
 
6966 (6085.09min - 6965.9max) MB/s +35%
MSI Prestige 13 AI Plus Evo A2VMG
 
6385 (5141.58min - 6384.59max) MB/s +24%
Durchschnitt der Klasse Subnotebook
  (694 - 13544, n=66, der letzten 2 Jahre)
5406 MB/s +5%
Dell Pro 13 Premium PA13250
Micron 2550 1TB
5167 (4591.13min - 5167.38max) MB/s
Durchschnittliche Micron 2550 1TB
  (4912 - 5200, n=5)
5131 MB/s -1%
Dell XPS 13 9350
Micron 2550 512GB
5057 (4337.25min - 5057.07max) MB/s -2%
Microsoft Surface Pro Copilot+
Samsung PM9B1 256GB MZ9L4256HCJQ
3634 (3212.91min - 3633.94max) MB/s -30%
seq q8 t1 write
Framework Laptop 13.5 Core Ultra 7 155H
 
6299 (6214.64min - 6298.78max) MB/s +50%
MSI Prestige 13 AI Plus Evo A2VMG
 
5859 (4402.55min - 5859.05max) MB/s +39%
Lenovo ThinkPad X13 2-in-1 Gen 5
Lenovo UMIS RPETJ1T24MHP2QDQ
5628 (5598.47min - 5627.71max) MB/s +34%
Durchschnitt der Klasse Subnotebook
  (107 - 9702, n=66, der letzten 2 Jahre)
4290 MB/s +2%
Dell Pro 13 Premium PA13250
Micron 2550 1TB
4213 (4176.44min - 4213.22max) MB/s
Dell XPS 13 9350
Micron 2550 512GB
4062 (3975.8min - 4061.61max) MB/s -4%
Durchschnittliche Micron 2550 1TB
  (2225 - 4612, n=5)
4029 MB/s -4%
Microsoft Surface Pro Copilot+
Samsung PM9B1 256GB MZ9L4256HCJQ
2435 (2059.61min - 2434.58max) MB/s -42%
4k q1 t1 read
Framework Laptop 13.5 Core Ultra 7 155H
 
72.4 (71.31min - 72.35max) MB/s +31%
Lenovo ThinkPad X13 2-in-1 Gen 5
Lenovo UMIS RPETJ1T24MHP2QDQ
67.2 (65.77min - 67.18max) MB/s +22%
Microsoft Surface Pro Copilot+
Samsung PM9B1 256GB MZ9L4256HCJQ
63.3 (61.13min - 63.27max) MB/s +15%
Durchschnittliche Micron 2550 1TB
  (51.2 - 78.1, n=5)
61.8 MB/s +12%
MSI Prestige 13 AI Plus Evo A2VMG
 
60.8 (59.81min - 60.77max) MB/s +10%
Durchschnitt der Klasse Subnotebook
  (19.9 - 95.2, n=66, der letzten 2 Jahre)
60.8 MB/s +10%
Dell Pro 13 Premium PA13250
Micron 2550 1TB
55.1 (51.41min - 55.07max) MB/s
Dell XPS 13 9350
Micron 2550 512GB
53.2 (50.58min - 53.24max) MB/s -3%
4k q1 t1 write
Lenovo ThinkPad X13 2-in-1 Gen 5
Lenovo UMIS RPETJ1T24MHP2QDQ
211 (194.11min - 211.37max) MB/s +64%
Durchschnittliche Micron 2550 1TB
  (128.5 - 273, n=5)
168.7 MB/s +31%
Durchschnitt der Klasse Subnotebook
  (22.5 - 360, n=66, der letzten 2 Jahre)
156.9 MB/s +22%
Dell XPS 13 9350
Micron 2550 512GB
139.2 (136.33min - 139.15max) MB/s +8%
Framework Laptop 13.5 Core Ultra 7 155H
 
132.5 (124.75min - 132.53max) MB/s +3%
Dell Pro 13 Premium PA13250
Micron 2550 1TB
128.5 (122.19min - 128.53max) MB/s
Microsoft Surface Pro Copilot+
Samsung PM9B1 256GB MZ9L4256HCJQ
114.6 (108.47min - 114.63max) MB/s -11%
MSI Prestige 13 AI Plus Evo A2VMG
 
114 (109.91min - 113.96max) MB/s -11%
4k q32 t16 read
Lenovo ThinkPad X13 2-in-1 Gen 5
Lenovo UMIS RPETJ1T24MHP2QDQ
3404 (2338.95min - 3403.52max) MB/s +439%
Durchschnitt der Klasse Subnotebook
  (207 - 4286, n=66, der letzten 2 Jahre)
1236 MB/s +96%
Microsoft Surface Pro Copilot+
Samsung PM9B1 256GB MZ9L4256HCJQ
1069 (1020.98min - 1069.39max) MB/s +69%
Framework Laptop 13.5 Core Ultra 7 155H
 
905 (794.35min - 904.75max) MB/s +43%
MSI Prestige 13 AI Plus Evo A2VMG
 
726 (612.46min - 725.52max) MB/s +15%
Dell XPS 13 9350
Micron 2550 512GB
640 (630.5min - 640.27max) MB/s +1%
Dell Pro 13 Premium PA13250
Micron 2550 1TB
631 (625.03min - 631.32max) MB/s
Durchschnittliche Micron 2550 1TB
  (416 - 709, n=5)
552 MB/s -13%
4k q32 t16 write
Lenovo ThinkPad X13 2-in-1 Gen 5
Lenovo UMIS RPETJ1T24MHP2QDQ
2094 (1559.42min - 2093.65max) MB/s +359%
Durchschnitt der Klasse Subnotebook
  (115.9 - 5007, n=66, der letzten 2 Jahre)
904 MB/s +98%
Durchschnittliche Micron 2550 1TB
  (350 - 1824, n=5)
672 MB/s +47%
Microsoft Surface Pro Copilot+
Samsung PM9B1 256GB MZ9L4256HCJQ
642 (635.59min - 642.04max) MB/s +41%
Dell Pro 13 Premium PA13250
Micron 2550 1TB
456 (400.41min - 455.9max) MB/s
Framework Laptop 13.5 Core Ultra 7 155H
 
377 (342.78min - 377.4max) MB/s -17%
Dell XPS 13 9350
Micron 2550 512GB
374 (359.04min - 373.65max) MB/s -18%
MSI Prestige 13 AI Plus Evo A2VMG
 
350 (325.75min - 350.22max) MB/s -23%
AS SSD
Score Total
Lenovo ThinkPad X13 2-in-1 Gen 5
Lenovo UMIS RPETJ1T24MHP2QDQ
6844 Points +103%
Framework Laptop 13.5 Core Ultra 7 155H
 
4631 Points +37%
Durchschnitt der Klasse Subnotebook
  (515 - 9875, n=65, der letzten 2 Jahre)
4349 Points +29%
Durchschnittliche Micron 2550 1TB
  (3374 - 4613, n=5)
3858 Points +14%
Dell Pro 13 Premium PA13250
Micron 2550 1TB
3374 Points
MSI Prestige 13 AI Plus Evo A2VMG
 
3373 Points 0%
Dell XPS 13 9350
Micron 2550 512GB
3176 Points -6%
Microsoft Surface Pro Copilot+
Samsung PM9B1 256GB MZ9L4256HCJQ
2764 Points -18%
Score Read
Lenovo ThinkPad X13 2-in-1 Gen 5
Lenovo UMIS RPETJ1T24MHP2QDQ
2550 Points +128%
Framework Laptop 13.5 Core Ultra 7 155H
 
1430 Points +28%
Durchschnitt der Klasse Subnotebook
  (246 - 4048, n=65, der letzten 2 Jahre)
1386 Points +24%
MSI Prestige 13 AI Plus Evo A2VMG
 
1225 Points +10%
Durchschnittliche Micron 2550 1TB
  (1001 - 1500, n=5)
1189 Points +6%
Dell Pro 13 Premium PA13250
Micron 2550 1TB
1117 Points
Dell XPS 13 9350
Micron 2550 512GB
1096 Points -2%
Microsoft Surface Pro Copilot+
Samsung PM9B1 256GB MZ9L4256HCJQ
764 Points -32%
Score Write
Lenovo ThinkPad X13 2-in-1 Gen 5
Lenovo UMIS RPETJ1T24MHP2QDQ
2864 Points +67%
Framework Laptop 13.5 Core Ultra 7 155H
 
2552 Points +48%
Durchschnitt der Klasse Subnotebook
  (153 - 4469, n=65, der letzten 2 Jahre)
2314 Points +35%
Durchschnittliche Micron 2550 1TB
  (1720 - 2763, n=5)
2099 Points +22%
Dell Pro 13 Premium PA13250
Micron 2550 1TB
1720 Points
Microsoft Surface Pro Copilot+
Samsung PM9B1 256GB MZ9L4256HCJQ
1638 Points -5%
MSI Prestige 13 AI Plus Evo A2VMG
 
1614 Points -6%
Dell XPS 13 9350
Micron 2550 512GB
1572 Points -9%
Seq Read
Framework Laptop 13.5 Core Ultra 7 155H
 
5447.92 MB/s +36%
MSI Prestige 13 AI Plus Evo A2VMG
 
4927.75 MB/s +23%
Durchschnitt der Klasse Subnotebook
  (448 - 8075, n=65, der letzten 2 Jahre)
4228 MB/s +6%
Durchschnittliche Micron 2550 1TB
  (4005 - 4291, n=5)
4077 MB/s +2%
Dell Pro 13 Premium PA13250
Micron 2550 1TB
4005 MB/s
Dell XPS 13 9350
Micron 2550 512GB
3933.86 MB/s -2%
Microsoft Surface Pro Copilot+
Samsung PM9B1 256GB MZ9L4256HCJQ
2763 MB/s -31%
Lenovo ThinkPad X13 2-in-1 Gen 5
Lenovo UMIS RPETJ1T24MHP2QDQ
1913 MB/s -52%
Seq Write
Lenovo ThinkPad X13 2-in-1 Gen 5
Lenovo UMIS RPETJ1T24MHP2QDQ
4554 MB/s +53%
Framework Laptop 13.5 Core Ultra 7 155H
 
3481.82 MB/s +17%
Dell Pro 13 Premium PA13250
Micron 2550 1TB
2977 MB/s
Durchschnittliche Micron 2550 1TB
  (2090 - 4126, n=5)
2940 MB/s -1%
Durchschnitt der Klasse Subnotebook
  (99 - 5120, n=65, der letzten 2 Jahre)
2778 MB/s -7%
MSI Prestige 13 AI Plus Evo A2VMG
 
2769.53 MB/s -7%
Dell XPS 13 9350
Micron 2550 512GB
2608.98 MB/s -12%
Microsoft Surface Pro Copilot+
Samsung PM9B1 256GB MZ9L4256HCJQ
1791 MB/s -40%
4K Read
Framework Laptop 13.5 Core Ultra 7 155H
 
65.88 MB/s +12%
Durchschnittliche Micron 2550 1TB
  (58.9 - 75.6, n=5)
64.5 MB/s +10%
Durchschnitt der Klasse Subnotebook
  (19.8 - 96.2, n=65, der letzten 2 Jahre)
60 MB/s +2%
Dell Pro 13 Premium PA13250
Micron 2550 1TB
58.9 MB/s
Microsoft Surface Pro Copilot+
Samsung PM9B1 256GB MZ9L4256HCJQ
57.4 MB/s -3%
MSI Prestige 13 AI Plus Evo A2VMG
 
57.15 MB/s -3%
Dell XPS 13 9350
Micron 2550 512GB
51.9 MB/s -12%
Lenovo ThinkPad X13 2-in-1 Gen 5
Lenovo UMIS RPETJ1T24MHP2QDQ
44.6 MB/s -24%
4K Write
Dell Pro 13 Premium PA13250
Micron 2550 1TB
207 MB/s
Durchschnittliche Micron 2550 1TB
  (176.9 - 218, n=5)
207 MB/s 0%
Microsoft Surface Pro Copilot+
Samsung PM9B1 256GB MZ9L4256HCJQ
183.5 MB/s -11%
Durchschnitt der Klasse Subnotebook
  (37.4 - 251, n=65, der letzten 2 Jahre)
175.6 MB/s -15%
Framework Laptop 13.5 Core Ultra 7 155H
 
172.76 MB/s -17%
Lenovo ThinkPad X13 2-in-1 Gen 5
Lenovo UMIS RPETJ1T24MHP2QDQ
169.9 MB/s -18%
Dell XPS 13 9350
Micron 2550 512GB
138.37 MB/s -33%
MSI Prestige 13 AI Plus Evo A2VMG
 
123.79 MB/s -40%
4K-64 Read
Lenovo ThinkPad X13 2-in-1 Gen 5
Lenovo UMIS RPETJ1T24MHP2QDQ
2314 MB/s +252%
Durchschnitt der Klasse Subnotebook
  (181.8 - 3417, n=65, der letzten 2 Jahre)
903 MB/s +37%
Framework Laptop 13.5 Core Ultra 7 155H
 
818.96 MB/s +24%
Durchschnittliche Micron 2550 1TB
  (537 - 995, n=5)
717 MB/s +9%
MSI Prestige 13 AI Plus Evo A2VMG
 
675.34 MB/s +3%
Dell Pro 13 Premium PA13250
Micron 2550 1TB
658 MB/s
Dell XPS 13 9350
Micron 2550 512GB
650.78 MB/s -1%
Microsoft Surface Pro Copilot+
Samsung PM9B1 256GB MZ9L4256HCJQ
430 MB/s -35%
4K-64 Write
Lenovo ThinkPad X13 2-in-1 Gen 5
Lenovo UMIS RPETJ1T24MHP2QDQ
2239 MB/s +84%
Framework Laptop 13.5 Core Ultra 7 155H
 
2030.88 MB/s +67%
Durchschnitt der Klasse Subnotebook
  (105.9 - 3905, n=65, der letzten 2 Jahre)
1858 MB/s +53%
Durchschnittliche Micron 2550 1TB
  (1215 - 2305, n=5)
1598 MB/s +32%
Microsoft Surface Pro Copilot+
Samsung PM9B1 256GB MZ9L4256HCJQ
1275 MB/s +5%
Dell Pro 13 Premium PA13250
Micron 2550 1TB
1215 MB/s
MSI Prestige 13 AI Plus Evo A2VMG
 
1213.4 MB/s 0%
Dell XPS 13 9350
Micron 2550 512GB
1172.49 MB/s -3%
Access Time Read
Lenovo ThinkPad X13 2-in-1 Gen 5
Lenovo UMIS RPETJ1T24MHP2QDQ
0.125 ms * -331%
Dell XPS 13 9350
Micron 2550 512GB
0.091 ms * -214%
Durchschnittliche Micron 2550 1TB
  (0.029 - 0.092, n=5)
0.0694 ms * -139%
Durchschnitt der Klasse Subnotebook
  (0.02 - 0.167, n=65, der letzten 2 Jahre)
0.05608 ms * -93%
Framework Laptop 13.5 Core Ultra 7 155H
 
0.048 ms * -66%
MSI Prestige 13 AI Plus Evo A2VMG
 
0.044 ms * -52%
Microsoft Surface Pro Copilot+
Samsung PM9B1 256GB MZ9L4256HCJQ
0.041 ms * -41%
Dell Pro 13 Premium PA13250
Micron 2550 1TB
0.029 ms *
Access Time Write
MSI Prestige 13 AI Plus Evo A2VMG
 
0.077 ms * -208%
Dell XPS 13 9350
Micron 2550 512GB
0.076 ms * -204%
Durchschnitt der Klasse Subnotebook
  (0.017 - 0.352, n=65, der letzten 2 Jahre)
0.06662 ms * -166%
Framework Laptop 13.5 Core Ultra 7 155H
 
0.062 ms * -148%
Durchschnittliche Micron 2550 1TB
  (0.025 - 0.063, n=5)
0.0446 ms * -78%
Microsoft Surface Pro Copilot+
Samsung PM9B1 256GB MZ9L4256HCJQ
0.03 ms * -20%
Dell Pro 13 Premium PA13250
Micron 2550 1TB
0.025 ms *
Lenovo ThinkPad X13 2-in-1 Gen 5
Lenovo UMIS RPETJ1T24MHP2QDQ
0.023 ms * +8%

* ... kleinere Werte sind besser

Dauerleistung Lesen: DiskSpd Read Loop, Queue Depth 8

035571010651420177521302485284031953550390542604615497053255680603563906745Tooltip
Dell Pro 13 Premium PA13250 Micron 2550 1TB; diskspd 2.0.17 f: Ø5029 (4028.72-5167.59)
MSI Prestige 13 AI Plus Evo A2VMG  ; diskspd 2.0.17 f: Ø6342 (5221.53-6365.13)
Lenovo ThinkPad X13 2-in-1 Gen 5 Lenovo UMIS RPETJ1T24MHP2QDQ; diskspd 2.0.17 f: Ø4996 (3195.01-7042.66)
Framework Laptop 13.5 Core Ultra 7 155H  ; diskspd 2.0.17 f: Ø6808 (5961.33-6969.47)
Dell XPS 13 9350 Micron 2550 512GB; diskspd 2.0.17 f: Ø5043 (4553.97-5060.22)
Microsoft Surface Pro Copilot+ Samsung PM9B1 256GB MZ9L4256HCJQ; diskspd 2.0.17 f: Ø3641 (3273.65-3660.18)

Grafikkarte

Die iGPU Intel Arc Graphics 140V ist eine recht schnelle integrierte Grafikkarte. In den synthetischen 3DMark-Benchmarks agiert sie auf Erwartungsniveau oder gar leicht darüber. Im Akkumodus haben wir keinen Leistungsrückgang in einem erneuten Fire-Strike-Durchgang messen können.

Und auch in Games kann sie überzeugen, fast alle Spiele laufen in Full-HD und mittleren Details oberhalb von 30 fps, teils reicht es sogar für hohe Details. Die 30-minütige Framerate in Cyberpunk 2077 sieht sehr konstant aus.
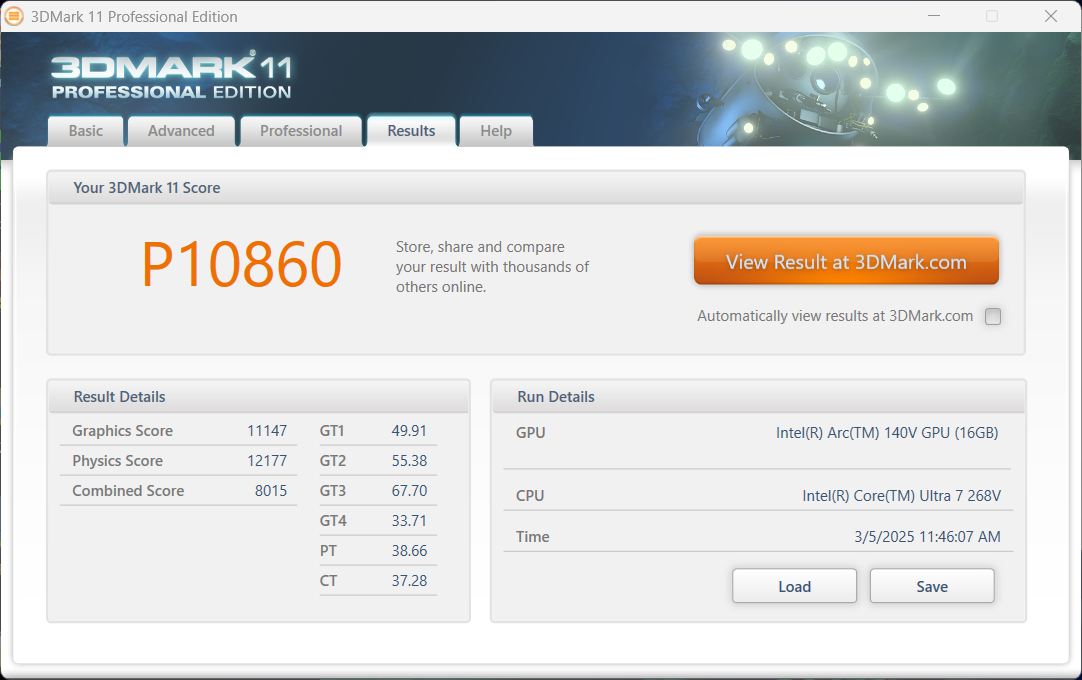
3DMark 11
3DMark 11
Fire Strike
Fire Strike
Time Spy
Time Spy
Cloud Gate
Cloud Gate
3DMark Performance Rating - Percent
Durchschnittliche Intel Arc Graphics 140V
 
96.3 pt
Dell XPS 13 9350
Intel Arc Graphics 140V, Intel Core Ultra 7 256V
95.5 pt
Dell Pro 13 Premium PA13250
Intel Arc Graphics 140V, Intel Core Ultra 7 268V
94.1 pt
MSI Prestige 13 AI Plus Evo A2VMG
Intel Arc Graphics 140V, Intel Core Ultra 7 258V
93.7 pt
Framework Laptop 13.5 Core Ultra 7 155H
Intel Arc 8-Core iGPU, Intel Core Ultra 7 155H
87 pt
Durchschnitt der Klasse Subnotebook
 
73 pt
Lenovo ThinkPad X13 2-in-1 Gen 5
Intel Graphics 4-Core iGPU (Arc), Intel Core Ultra 7 165U
53.1 pt
Microsoft Surface Pro Copilot+ -1!
Qualcomm SD X Adreno X1-85 3.8 TFLOPS, Qualcomm Snapdragon X Plus X1P-64-100
52.9 pt
3DMark 11 - 1280x720 Performance GPU
Framework Laptop 13.5 Core Ultra 7 155H
Intel Arc 8-Core iGPU, Intel Core Ultra 7 155H
12739 Points +14%
Durchschnittliche Intel Arc Graphics 140V
  (10499 - 12772, n=22)
11341 Points +2%
Dell Pro 13 Premium PA13250
Intel Arc Graphics 140V, Intel Core Ultra 7 268V
11147 Points
Dell XPS 13 9350
Intel Arc Graphics 140V, Intel Core Ultra 7 256V
10651 Points -4%
MSI Prestige 13 AI Plus Evo A2VMG
Intel Arc Graphics 140V, Intel Core Ultra 7 258V
10499 Points -6%
Durchschnitt der Klasse Subnotebook
  (995 - 16296, n=65, der letzten 2 Jahre)
9623 Points -14%
Lenovo ThinkPad X13 2-in-1 Gen 5
Intel Graphics 4-Core iGPU (Arc), Intel Core Ultra 7 165U
6587 Points -41%
Microsoft Surface Pro Copilot+
Qualcomm SD X Adreno X1-85 3.8 TFLOPS, Qualcomm Snapdragon X Plus X1P-64-100
6429 Points -42%
3DMark
1280x720 Cloud Gate Standard Graphics
Dell XPS 13 9350
Intel Arc Graphics 140V, Intel Core Ultra 7 256V
54751 Points +2%
Durchschnittliche Intel Arc Graphics 140V
  (42294 - 61591, n=11)
54419 Points +1%
Dell Pro 13 Premium PA13250
Intel Arc Graphics 140V, Intel Core Ultra 7 268V
53802 Points
MSI Prestige 13 AI Plus Evo A2VMG
Intel Arc Graphics 140V, Intel Core Ultra 7 258V
52639 Points -2%
Framework Laptop 13.5 Core Ultra 7 155H
Intel Arc 8-Core iGPU, Intel Core Ultra 7 155H
42140 Points -22%
Durchschnitt der Klasse Subnotebook
  (5577 - 61591, n=30, der letzten 2 Jahre)
40405 Points -25%
Lenovo ThinkPad X13 2-in-1 Gen 5
Intel Graphics 4-Core iGPU (Arc), Intel Core Ultra 7 165U
29783 Points -45%
1920x1080 Fire Strike Graphics
Durchschnittliche Intel Arc Graphics 140V
  (6790 - 10476, n=23)
9629 Points +1%
Dell Pro 13 Premium PA13250
Intel Arc Graphics 140V, Intel Core Ultra 7 268V
9554 Points
MSI Prestige 13 AI Plus Evo A2VMG
Intel Arc Graphics 140V, Intel Core Ultra 7 258V
9503 Points -1%
Dell XPS 13 9350
Intel Arc Graphics 140V, Intel Core Ultra 7 256V
9492 Points -1%
Framework Laptop 13.5 Core Ultra 7 155H
Intel Arc 8-Core iGPU, Intel Core Ultra 7 155H
8513 Points -11%
Durchschnitt der Klasse Subnotebook
  (832 - 11887, n=68, der letzten 2 Jahre)
7226 Points -24%
Microsoft Surface Pro Copilot+
Qualcomm SD X Adreno X1-85 3.8 TFLOPS, Qualcomm Snapdragon X Plus X1P-64-100
6410 Points -33%
Lenovo ThinkPad X13 2-in-1 Gen 5
Intel Graphics 4-Core iGPU (Arc), Intel Core Ultra 7 165U
5465 Points -43%
2560x1440 Time Spy Graphics
Dell XPS 13 9350
Intel Arc Graphics 140V, Intel Core Ultra 7 256V
4115 Points +10%
MSI Prestige 13 AI Plus Evo A2VMG
Intel Arc Graphics 140V, Intel Core Ultra 7 258V
4006 Points +7%
Durchschnittliche Intel Arc Graphics 140V
  (2955 - 4415, n=26)
3983 Points +6%
Dell Pro 13 Premium PA13250
Intel Arc Graphics 140V, Intel Core Ultra 7 268V
3755 Points
Framework Laptop 13.5 Core Ultra 7 155H
Intel Arc 8-Core iGPU, Intel Core Ultra 7 155H
3401 Points -9%
Durchschnitt der Klasse Subnotebook
  (804 - 4501, n=67, der letzten 2 Jahre)
2781 Points -26%
Lenovo ThinkPad X13 2-in-1 Gen 5
Intel Graphics 4-Core iGPU (Arc), Intel Core Ultra 7 165U
2037 Points -46%
Microsoft Surface Pro Copilot+
Qualcomm SD X Adreno X1-85 3.8 TFLOPS, Qualcomm Snapdragon X Plus X1P-64-100
1715 Points -54%
3DMark 11 Performance
10860 Punkte
3DMark Cloud Gate Standard Score
28837 Punkte
3DMark Fire Strike Score
8163 Punkte
3DMark Time Spy Score
3969 Punkte
Hilfe
Blender
v3.3 Classroom CPU
Lenovo ThinkPad X13 2-in-1 Gen 5
Intel Graphics 4-Core iGPU (Arc), Intel Core Ultra 7 165U
827 Seconds * -18%
Microsoft Surface Pro Copilot+
Qualcomm SD X Adreno X1-85 3.8 TFLOPS, Qualcomm Snapdragon X Plus X1P-64-100
751 Seconds * -8%
Dell Pro 13 Premium PA13250
Intel Arc Graphics 140V, Intel Core Ultra 7 268V
698 Seconds *
Durchschnittliche Intel Arc Graphics 140V
  (509 - 700, n=23)
581 Seconds * +17%
Dell XPS 13 9350
Intel Arc Graphics 140V, Intel Core Ultra 7 256V
580 Seconds * +17%
Durchschnitt der Klasse Subnotebook
  (241 - 1127, n=70, der letzten 2 Jahre)
547 Seconds * +22%
MSI Prestige 13 AI Plus Evo A2VMG
Intel Arc Graphics 140V, Intel Core Ultra 7 258V
532 Seconds * +24%
Framework Laptop 13.5 Core Ultra 7 155H
Intel Arc 8-Core iGPU, Intel Core Ultra 7 155H
451 Seconds * +35%
v3.3 Classroom oneAPI/Intel
Dell Pro 13 Premium PA13250
Intel Arc Graphics 140V, Intel Core Ultra 7 268V
368 Seconds *
Lenovo ThinkPad X13 2-in-1 Gen 5
Intel Graphics 4-Core iGPU (Arc), Intel Core Ultra 7 165U
347 Seconds * +6%
Durchschnittliche Intel Arc Graphics 140V
  (205 - 405, n=11)
275 Seconds * +25%
Durchschnitt der Klasse Subnotebook
  (210 - 368, n=7, der letzten 2 Jahre)
258 Seconds * +30%
Framework Laptop 13.5 Core Ultra 7 155H
Intel Arc 8-Core iGPU, Intel Core Ultra 7 155H
235 Seconds * +36%
Dell XPS 13 9350
Intel Arc Graphics 140V, Intel Core Ultra 7 256V
211 Seconds * +43%
MSI Prestige 13 AI Plus Evo A2VMG
Intel Arc Graphics 140V, Intel Core Ultra 7 258V
210 Seconds * +43%

* ... kleinere Werte sind besser

Performance Rating - Percent
MSI Prestige 13 AI Plus Evo A2VMG
Intel Core Ultra 7 258V, Intel Arc Graphics 140V
98.6 pt
Dell Pro 13 Premium PA13250
Intel Core Ultra 7 268V, Intel Arc Graphics 140V
94.7 pt
Dell XPS 13 9350
Intel Core Ultra 7 256V, Intel Arc Graphics 140V
89.2 pt
Framework Laptop 13.5 Core Ultra 7 155H
Intel Core Ultra 7 155H, Intel Arc 8-Core iGPU
79.8 pt
Durchschnitt der Klasse Subnotebook
 
77.9 pt
Microsoft Surface Pro Copilot+ -1!
Qualcomm Snapdragon X Plus X1P-64-100, Qualcomm SD X Adreno X1-85 3.8 TFLOPS
58.3 pt
Lenovo ThinkPad X13 2-in-1 Gen 5
Intel Core Ultra 7 165U, Intel Graphics 4-Core iGPU (Arc)
44 pt
Cyberpunk 2077 2.2 Phantom Liberty - 1920x1080 Ultra Preset (FSR off)
MSI Prestige 13 AI Plus Evo A2VMG
Intel Core Ultra 7 258V, Intel Arc Graphics 140V
28.5 (23.3min) fps +1%
Dell Pro 13 Premium PA13250
Intel Core Ultra 7 268V, Intel Arc Graphics 140V
28.1 (22.8min) fps
Framework Laptop 13.5 Core Ultra 7 155H
Intel Core Ultra 7 155H, Intel Arc 8-Core iGPU
21.1 (17.4min) fps -25%
Durchschnitt der Klasse Subnotebook
  (8.48 - 31.4, n=49, der letzten 2 Jahre)
20.8 fps -26%
Dell XPS 13 9350
Intel Core Ultra 7 256V, Intel Arc Graphics 140V
19.1 (15.5min) fps -32%
Microsoft Surface Pro Copilot+
Qualcomm Snapdragon X Plus X1P-64-100, Qualcomm SD X Adreno X1-85 3.8 TFLOPS
14.3 (11.1min) fps -49%
Lenovo ThinkPad X13 2-in-1 Gen 5
Intel Core Ultra 7 165U, Intel Graphics 4-Core iGPU (Arc)
10.7 (8.84min) fps -62%
Baldur's Gate 3 - 1920x1080 Ultra Preset AA:T
Dell Pro 13 Premium PA13250
Intel Core Ultra 7 268V, Intel Arc Graphics 140V
30.8 fps
MSI Prestige 13 AI Plus Evo A2VMG
Intel Core Ultra 7 258V, Intel Arc Graphics 140V
29.1 fps -6%
Framework Laptop 13.5 Core Ultra 7 155H
Intel Core Ultra 7 155H, Intel Arc 8-Core iGPU
25.7 fps -17%
Dell XPS 13 9350
Intel Core Ultra 7 256V, Intel Arc Graphics 140V
25.7 fps -17%
Durchschnitt der Klasse Subnotebook
  (12.1 - 31.1, n=45, der letzten 2 Jahre)
22.4 fps -27%
Microsoft Surface Pro Copilot+
Qualcomm Snapdragon X Plus X1P-64-100, Qualcomm SD X Adreno X1-85 3.8 TFLOPS
16.6 fps -46%
Lenovo ThinkPad X13 2-in-1 Gen 5
Intel Core Ultra 7 165U, Intel Graphics 4-Core iGPU (Arc)
13.5 fps -56%
GTA V - 1920x1080 Highest Settings possible AA:4xMSAA + FX AF:16x
MSI Prestige 13 AI Plus Evo A2VMG
Intel Core Ultra 7 258V, Intel Arc Graphics 140V
26.7 (3.24min, 21.3P1) fps +2%
Dell Pro 13 Premium PA13250
Intel Core Ultra 7 268V, Intel Arc Graphics 140V
26.3 (6.46min, 20P1) fps
Dell XPS 13 9350
Intel Core Ultra 7 256V, Intel Arc Graphics 140V
25.6 (2.46min, 19.6P1) fps -3%
Microsoft Surface Pro Copilot+
Qualcomm Snapdragon X Plus X1P-64-100, Qualcomm SD X Adreno X1-85 3.8 TFLOPS
20.8 (2.32min, 12.3P1) fps -21%
Durchschnitt der Klasse Subnotebook
  (7.81 - 53, n=64, der letzten 2 Jahre)
20.5 fps -22%
Framework Laptop 13.5 Core Ultra 7 155H
Intel Core Ultra 7 155H, Intel Arc 8-Core iGPU
17.5 (2.07min, 12P1) fps -33%
Lenovo ThinkPad X13 2-in-1 Gen 5
Intel Core Ultra 7 165U, Intel Graphics 4-Core iGPU (Arc)
9.45 (1.644min, 7.41P1) fps -64%
Final Fantasy XV Benchmark - 1920x1080 High Quality
MSI Prestige 13 AI Plus Evo A2VMG
Intel Core Ultra 7 258V, Intel Arc Graphics 140V
31.7 fps +9%
Dell XPS 13 9350
Intel Core Ultra 7 256V, Intel Arc Graphics 140V
31.5 fps +8%
Dell Pro 13 Premium PA13250
Intel Core Ultra 7 268V, Intel Arc Graphics 140V
29.1 fps
Framework Laptop 13.5 Core Ultra 7 155H
Intel Core Ultra 7 155H, Intel Arc 8-Core iGPU
27.2 fps -7%
Durchschnitt der Klasse Subnotebook
  (11.9 - 44.2, n=70, der letzten 2 Jahre)
24.5 fps -16%
Microsoft Surface Pro Copilot+
Qualcomm Snapdragon X Plus X1P-64-100, Qualcomm SD X Adreno X1-85 3.8 TFLOPS
15.7 fps -46%
Lenovo ThinkPad X13 2-in-1 Gen 5
Intel Core Ultra 7 165U, Intel Graphics 4-Core iGPU (Arc)
12.2 fps -58%
Strange Brigade - 1920x1080 ultra AA:ultra AF:16
Dell XPS 13 9350
Intel Core Ultra 7 256V, Intel Arc Graphics 140V
58 (24.7min, 30.7P1) fps 0%
Dell Pro 13 Premium PA13250
Intel Core Ultra 7 268V, Intel Arc Graphics 140V
57.8 (16min, 33.5P1) fps
MSI Prestige 13 AI Plus Evo A2VMG
Intel Core Ultra 7 258V, Intel Arc Graphics 140V
55.4 (21.6min, 28.3P1) fps -4%
Framework Laptop 13.5 Core Ultra 7 155H
Intel Core Ultra 7 155H, Intel Arc 8-Core iGPU
48.5 (12.8min, 21.5P1) fps -16%
Durchschnitt der Klasse Subnotebook
  (17.7 - 70.7, n=67, der letzten 2 Jahre)
42.8 fps -26%
Microsoft Surface Pro Copilot+
Qualcomm Snapdragon X Plus X1P-64-100, Qualcomm SD X Adreno X1-85 3.8 TFLOPS
37 fps -36%
Lenovo ThinkPad X13 2-in-1 Gen 5
Intel Core Ultra 7 165U, Intel Graphics 4-Core iGPU (Arc)
26.6 (5min, 5.64P1) fps -54%
Dota 2 Reborn - 1920x1080 ultra (3/3) best looking
MSI Prestige 13 AI Plus Evo A2VMG
Intel Core Ultra 7 258V, Intel Arc Graphics 140V
83 (51.5min) fps +17%
Dell XPS 13 9350
Intel Core Ultra 7 256V, Intel Arc Graphics 140V
80.7 (52.1min) fps +13%
Dell Pro 13 Premium PA13250
Intel Core Ultra 7 268V, Intel Arc Graphics 140V
71.2 (43.6min) fps
Durchschnitt der Klasse Subnotebook
  (13 - 99.5, n=72, der letzten 2 Jahre)
64.6 fps -9%
Framework Laptop 13.5 Core Ultra 7 155H
Intel Core Ultra 7 155H, Intel Arc 8-Core iGPU
62.1 (35.2min) fps -13%
Lenovo ThinkPad X13 2-in-1 Gen 5
Intel Core Ultra 7 165U, Intel Graphics 4-Core iGPU (Arc)
47.9 (31.4min) fps -33%
Lenovo ThinkPad X13 2-in-1 Gen 5
Intel Core Ultra 7 165U, Intel Graphics 4-Core iGPU (Arc)
39.9 (25min) fps -44%
Microsoft Surface Pro Copilot+
Qualcomm Snapdragon X Plus X1P-64-100, Qualcomm SD X Adreno X1-85 3.8 TFLOPS
45 (33.5min) fps -37%
X-Plane 11.11 - 1920x1080 high (fps_test=3)
MSI Prestige 13 AI Plus Evo A2VMG
Intel Core Ultra 7 258V, Intel Arc Graphics 140V
36.9 fps +13%
Durchschnitt der Klasse Subnotebook
  (20.7 - 97.1, n=61, der letzten 2 Jahre)
34.6 fps +6%
Framework Laptop 13.5 Core Ultra 7 155H
Intel Core Ultra 7 155H, Intel Arc 8-Core iGPU
33.7 fps +3%
Dell Pro 13 Premium PA13250
Intel Core Ultra 7 268V, Intel Arc Graphics 140V
32.7 fps
Dell XPS 13 9350
Intel Core Ultra 7 256V, Intel Arc Graphics 140V
30.1 fps -8%
Lenovo ThinkPad X13 2-in-1 Gen 5
Intel Core Ultra 7 165U, Intel Graphics 4-Core iGPU (Arc)
20.8 fps -36%
Lenovo ThinkPad X13 2-in-1 Gen 5
Intel Core Ultra 7 165U, Intel Graphics 4-Core iGPU (Arc)
19.1 fps -42%

Cyberpunk 2077 ultra FPS-Diagramm

0510152025Tooltip
Dell Pro 13 Premium PA13250 Core Ultra 7 268V, Arc 140V: Ø24.5 (23-25.4)
MSI Prestige 13 AI Plus Evo A2VMG Core Ultra 7 258V, Arc 140V: Ø24.7 (22.9-25.7)
Lenovo ThinkPad X13 2-in-1 Gen 5 Ultra 7 165U, Graphics 4-Core: Ø8.65 (7.01-12.4)
Framework Laptop 13.5 Core Ultra 7 155H Ultra 7 155H, Arc 8-Core: Ø20.5 (18.1-21.9)
Dell XPS 13 9350 Core Ultra 7 256V, Arc 140V: Ø22.2 (18.3-23.3)
Microsoft Surface Pro Copilot+ SD X Plus X1P-64-100, Adreno X1-85 3.8 TFLOPS: Ø10.8 (8.97-12)
min.mittelhochmax.
GTA V (2015) 153.4 140 26.3
Dota 2 Reborn (2015) 107.5 101.7 87.8 71.2
Final Fantasy XV Benchmark (2018) 74.9 42.3 29.1
X-Plane 11.11 (2018) 48.1 36.7 32.7
Strange Brigade (2018) 223 83.3 69.5 57.8
Baldur's Gate 3 (2023) 45.5 35.7 31.3 30.8
Cyberpunk 2077 2.2 Phantom Liberty (2023) 43.5 35.4 28.6 28.1

Emissionen & Energie - Sparsames Dell Pro

Geräuschemissionen

Im Idle sind die Lüfter für gewöhnlich still. Unter maximaler Last messen wir beim Gaming einen Höchstwert von 42 dB, in der Realität sind es weniger, selbst im Stresstest waren es oft nur 36 oder 37 dB.

Lautstärkediagramm

Idle
23 / 23 / 23 dB(A)
Last
37 / 42.74 dB(A)
  red to green bar
 
 
30 dB
leise
40 dB(A)
deutlich hörbar
50 dB(A)
störend
 
min: dark, med: mid, max: light   Earthworks M23R, Arta (aus 15 cm gemessen)   Umgebungsgeräusche: 23 dB(A)
dB(A) 0102030405060708090Deep BassMiddle BassHigh BassLower RangeMidsHigher MidsLower HighsMid HighsUpper HighsSuper Highs203230.2322539.931.539.93141.832.141.8403132.4315026.43326.46329.722.529.78031.91431.910028.215.828.21251913.81916021.113.421.120023.215.823.225023.718.423.731525.619.225.640023.111.623.150025.69.625.663027.57.827.580027.8827.81000278.427125026.98.326.9160030.79.230.7200031.59.631.5250033.410.633.4315032.110.832.1400032.711.432.7500031.911.631.9630033.311.933.3800029.712.329.71000022.81322.81250018.212.118.21600014.912.214.9SPL42.723.342.7N4.10.54.1median 27median 11.6median 27Delta4.72.44.732.838.132.139.633.822.427.22430.823.123.526.628.429.521.121.42722.623.22226.224.823.227.826.828.728.62728.928.224.7282321.825.225.122.821.719.432.426.919.916.916.128.225.619.816.617.934.225.222.71817.332.327.431.517.515.934.733.622.520.61936.828.322.518.718.335.429.721.916.514.734.929.221.314.112.735.130.122.911.410.536.130.823.59.71036.43124.79.59.536.93225.69.69.838.133.328.31010.13934.127.910.110.239.43425.710.810.539.534.125.211.911.340.835.923.51312.141.930.819.212.611.840.328.217.513.311.538.625.51512.111.535.722.113.811.811.433.118.112.311.910.628.644.536.824.824.150.84.82.50.60.67.8median 29.7median 22.7median 12.6median 11.5median 36.13.52.83.22.92.7hearing rangehide median Fan NoiseDell Pro 13 Premium PA13250MSI Prestige 13 AI Plus Evo A2VMG
Dell Pro 13 Premium PA13250
Arc 140V, Core Ultra 7 268V, Micron 2550 1TB
MSI Prestige 13 AI Plus Evo A2VMG
Arc 140V, Core Ultra 7 258V
Lenovo ThinkPad X13 2-in-1 Gen 5
Graphics 4-Core, Ultra 7 165U, Lenovo UMIS RPETJ1T24MHP2QDQ
Framework Laptop 13.5 Core Ultra 7 155H
Arc 8-Core, Ultra 7 155H
Dell XPS 13 9350
Arc 140V, Core Ultra 7 256V, Micron 2550 512GB
Microsoft Surface Pro Copilot+
Adreno X1-85 3.8 TFLOPS, SD X Plus X1P-64-100, Samsung PM9B1 256GB MZ9L4256HCJQ
Geräuschentwicklung
-8%
4%
-7%
3%
2%
aus / Umgebung *
23
24.1
-5%
23
-0%
24
-4%
24.1
-5%
23.8
-3%
Idle min *
23
24.8
-8%
23
-0%
24.1
-5%
24.4
-6%
23.8
-3%
Idle avg *
23
24.8
-8%
23
-0%
25.1
-9%
24.4
-6%
23.8
-3%
Idle max *
23
26.7
-16%
23
-0%
27
-17%
24.4
-6%
23.8
-3%
Last avg *
37
36.8
1%
34.44
7%
38.4
-4%
26.2
29%
23.8
36%
Cyberpunk 2077 ultra *
42.74
44.5
-4%
38.28
10%
43.7
-2%
34.2
20%
44.7
-5%
Last max *
42.74
50.8
-19%
39.04
9%
45.8
-7%
45.2
-6%
44.7
-5%

* ... kleinere Werte sind besser

Temperatur

Im Gegensatz zu vielen Office- und Business-Konkurrenten dieser Größe setzt das Dell Pro 13 Premium auf zwei statt nur einen Lüfter und das kommt bei den Oberflächentemperaturen positiv zur Geltung. Beim Gaming wird es wärmer als in unserem Stresstest, aber selbst hier messen wir Hotspots von gerade einmal 37 °C. Beide Laptopseiten werden dabei gleichermaßen gekühlt anstatt nur einseitig wie bei einigen Konkurrenten.

Max. Last
 27 °C31 °C29 °C 
 27 °C29 °C26 °C 
 24 °C23 °C23 °C 
Maximal: 31 °C
Durchschnitt: 26.6 °C
31 °C31 °C30 °C
24 °C28 °C26 °C
23 °C23 °C23 °C
Maximal: 31 °C
Durchschnitt: 26.6 °C
Netzteil (max.)  33 °C | Raumtemperatur 18.5 °C | Fluke t3000FC (calibrated), Fluke 62 Mini
(+) Die Durchschnittstemperatur auf der Oberseite unter extremer Last ist 26.6 °C. Im Vergleich erhitzte sich der Durchschnitt der Geräteklasse Subnotebook auf 30.8 °C.
(+) Die maximale Temperatur auf der Oberseite ist 31 °C. Im Vergleich liegt der Klassendurchschnitt bei 35.9 °C (von 21.4 bis 59 °C für die Klasse Subnotebook).
(+) Auf der Unterseite messen wir eine maximalen Wert von 31 °C (im Vergleich zum Durchschnitt von 39.3 °C).
(+) Ohne Last messen wir eine durchschnittliche Temperatur von 22.3 °C auf der Oberseite. Der Klassendurchschnitt erreicht 30.8 °C.
(+) 3: The average temperature for the upper side is 28.8 °C / 84 F, compared to the average of 30.8 °C / 87 F for the class Subnotebook.
(+) Die Handballen und der Touchpad-Bereich sind mit gemessenen 26 °C kühler als die typische Hauttemperatur und fühlen sich dadurch kühl an.
(+) Die durchschnittliche Handballen-Temperatur anderer getesteter Geräte war 28.2 °C (+2.2 °C).
Stresstest oben
Stresstest oben
Stresstest Netzteil
Stresstest Netzteil
Stresstest unten
Stresstest unten
Dell Pro 13 Premium PA13250
Intel Core Ultra 7 268V, Intel Arc Graphics 140V
MSI Prestige 13 AI Plus Evo A2VMG
Intel Core Ultra 7 258V, Intel Arc Graphics 140V
Lenovo ThinkPad X13 2-in-1 Gen 5
Intel Core Ultra 7 165U, Intel Graphics 4-Core iGPU (Arc)
Framework Laptop 13.5 Core Ultra 7 155H
Intel Core Ultra 7 155H, Intel Arc 8-Core iGPU
Dell XPS 13 9350
Intel Core Ultra 7 256V, Intel Arc Graphics 140V
Microsoft Surface Pro Copilot+
Qualcomm Snapdragon X Plus X1P-64-100, Qualcomm SD X Adreno X1-85 3.8 TFLOPS
Hitze
-23%
-52%
-29%
-12%
-25%
Last oben max *
31
43.4
-40%
60
-94%
42.8
-38%
34.8
-12%
43.9
-42%
Last unten max *
31
42.4
-37%
57
-84%
45.2
-46%
37.4
-21%
44.9
-45%
Idle oben max *
24
25.4
-6%
27
-13%
27.2
-13%
25.4
-6%
26.2
-9%
Idle unten max *
24
25.6
-7%
28
-17%
28.6
-19%
26.2
-9%
24.6
-3%

* ... kleinere Werte sind besser

Lautsprecher

Für einen so kleinen Laptop übertönen die Lautsprecher sogar manch deutlich größeren Vertreter. Die Mitten sind ausgeglichen, an Bass fehlt es ihnen trotzdem. Ein Audio-Klinkeneingang steht für externe Geräte bereit.

dB(A) 0102030405060708090Deep BassMiddle BassHigh BassLower RangeMidsHigher MidsLower HighsMid HighsUpper HighsSuper Highs2035.630.235.62548.231.548.23150.932.150.94038.632.438.65030.33330.3633322.5338033.91433.910046.915.846.912552.313.852.316058.113.458.12006315.86325062.218.462.231563.419.263.440070.411.670.4500779.67763077.87.877.880076.8876.8100078.28.478.2125075.58.375.5160074.19.274.1200071.99.671.9250077.210.677.2315074.910.874.9400073.511.473.550007711.677630078.311.978.380006312.3631000061.31361.31250063.412.163.4160006812.268SPL87.523.387.5N780.578median 73.5median 11.6median 73.5Delta72.4730.132.130.121.62421.621.728.421.722.222.622.223.423.223.428272824.12324.129.821.729.839.716.939.751.616.651.652185254.217.554.253.320.653.354.618.754.658.916.558.960.814.160.866.211.466.269.49.769.474.29.574.274.69.674.673.81073.871.610.171.673.610.873.673.911.973.976.21376.269.812.669.871.413.371.469.212.169.263.111.863.162.411.962.484.524.884.558.10.658.1median 66.2median 12.6median 66.28.83.28.8hearing rangehide median Pink NoiseDell Pro 13 Premium PA13250MSI Prestige 13 AI Plus Evo A2VMG
Frequenzdiagramm (für Vergleiche die Checkboxen oben an-/abwählen)
Dell Pro 13 Premium PA13250 Audio Analyse

(+) | Die Lautsprecher können relativ laut spielen (87.49 dB)
Bass 100 - 315 Hz
(-) | kaum Bass - 15.9% niedriger als der Median
(±) | durchschnittlich lineare Bass-Wiedergabe (8.3% Delta zum Vorgänger)
Mitteltöne 400 - 2000 Hz
(+) | ausgeglichene Mitten, vom Median nur 2.9% abweichend
(+) | lineare Mitten (4.7% Delta zum Vorgänger)
Hochtöne 2 - 16 kHz
(±) | verringerte Hochtöne, 5.2% geringer als der Median
(±) | durchschnittlich lineare Hochtöne (7.1% Delta zum Vorgänger)
Gesamt im hörbaren Bereich 100 - 16.000 Hz
(+) | hörbarer Bereich ist sehr linear (12.2% Abstand zum Median
Im Vergleich zu allen Geräten derselben Klasse
» 14% aller getesteten Geräte dieser Klasse waren besser, 4% vergleichbar, 82% schlechter
» Das beste Gerät hat einen Delta-Wert von 5%, durchschnittlich ist 19%, das schlechteste Gerät hat 53%
Im Vergleich zu allen Geräten im Test
» 9% aller getesteten Geräte waren besser, 2% vergleichbar, 89% schlechter
» Das beste Gerät hat einen Delta-Wert von 4%, durchschnittlich ist 24%, das schlechteste Gerät hat 134%

MSI Prestige 13 AI Plus Evo A2VMG Audio Analyse

(+) | Die Lautsprecher können relativ laut spielen (84.5 dB)
Bass 100 - 315 Hz
(-) | kaum Bass - 19.4% niedriger als der Median
(±) | durchschnittlich lineare Bass-Wiedergabe (9.6% Delta zum Vorgänger)
Mitteltöne 400 - 2000 Hz
(±) | zu hohe Mitten, vom Median 6.4% abweichend
(+) | lineare Mitten (5.1% Delta zum Vorgänger)
Hochtöne 2 - 16 kHz
(±) | zu hohe Hochtöne, vom Median nur 6.1% abweichend
(+) | sehr lineare Hochtöne (4.6% Delta zum Vorgänger)
Gesamt im hörbaren Bereich 100 - 16.000 Hz
(±) | hörbarer Bereich ist durchschnittlich linear (18.2% Abstand zum Median)
Im Vergleich zu allen Geräten derselben Klasse
» 51% aller getesteten Geräte dieser Klasse waren besser, 7% vergleichbar, 43% schlechter
» Das beste Gerät hat einen Delta-Wert von 5%, durchschnittlich ist 19%, das schlechteste Gerät hat 53%
Im Vergleich zu allen Geräten im Test
» 37% aller getesteten Geräte waren besser, 8% vergleichbar, 56% schlechter
» Das beste Gerät hat einen Delta-Wert von 4%, durchschnittlich ist 24%, das schlechteste Gerät hat 134%

Energieaufnahme

Dank Lunar-Lake-SoC ist das Dell Pro 13 sehr sparsam. Im Idle werden nur 2 bis 4,75 W verbraucht, unter Cyberpunk 2077 messen wir gerade einmal 38 W. Minimal sparsamer ist nur das Dell XPS 13 9350 mit leicht schwächerer Lunar-Lake-CPU, alle anderen Konkurrenten verbrauchen mehr.

Stromverbrauch
Aus / Standbydarklight 0.15 / 0.6 Watt
Idledarkmidlight 2 / 4.3 / 4.75 Watt
Last midlight 40 / 57 Watt
 color bar
Legende: min: dark, med: mid, max: light        Metrahit Energy
Dell Pro 13 Premium PA13250
Core Ultra 7 268V, Arc 140V
MSI Prestige 13 AI Plus Evo A2VMG
Core Ultra 7 258V, Arc 140V
Lenovo ThinkPad X13 2-in-1 Gen 5
Ultra 7 165U, Graphics 4-Core
Framework Laptop 13.5 Core Ultra 7 155H
Ultra 7 155H, Arc 8-Core
Dell XPS 13 9350
Core Ultra 7 256V, Arc 140V
Microsoft Surface Pro Copilot+
SD X Plus X1P-64-100, Adreno X1-85 3.8 TFLOPS
Durchschnitt der Klasse Subnotebook
 
Stromverbrauch
-39%
-19%
-26%
7%
-23%
-62%
Idle min *
2
3.5
-75%
3.2
-60%
2.5
-25%
1.3
35%
1.9
5%
Idle avg *
4.3
5.9
-37%
6.1
-42%
5.2
-21%
2.5
42%
9.2
-114%
Idle max *
4.75
10
-111%
6.7
-41%
5.8
-22%
4.1
14%
9.5
-100%
Last avg *
40
38.7
3%
44.2
-11%
47.5
-19%
40.1
-0%
29.6
26%
Cyberpunk 2077 ultra *
36.4
46.3
-27%
25.2
31%
54.5
-50%
46.1
-27%
39.5
-9%
Cyberpunk 2077 ultra external monitor *
38
45.6
-20%
38.5
-1%
52.4
-38%
43.1
-13%
37.4
2%
Last max *
57
61.5
-8%
62.5
-10%
61.5
-8%
57.3
-1%
40.7
29%

* ... kleinere Werte sind besser

Energieaufnahme Cyberpunk / Stresstest

0510152025303540455055Tooltip
Dell Pro 13 Premium PA13250; 1280x720 Prime95 28.10 and Furmark 1.25: Ø30.9 (19.688-56.969)
Dell Pro 13 Premium PA13250; Idle 150cd/m2: Ø3.19 (2.8945-5.5167)
Dell Pro 13 Premium PA13250; Cyberpunk 2077 FHD ultra no FSR 150cd: Ø36.4 (34.398-42.045)

Energieaufnahme mit externem Monitor

05101520253035404550Tooltip
Dell Pro 13 Premium PA13250; Prime95 V2810 Stress (external Monitor): Ø41.1 (26.01-54.193)
Dell Pro 13 Premium PA13250; Cinebench R15 Multi (external Monitor): Ø51.2 (50.455-52.108)
Dell Pro 13 Premium PA13250; Cinebench R23 Multi (external Monitor): Ø41.7 (21.57-52.074)
Dell Pro 13 Premium PA13250; 1280x720 FurMark 1.19 GPU Stress Test (external Monitor): Ø31.6 (26.101-39.104)
Dell Pro 13 Premium PA13250; Idle 1min (external Monitor): Ø3.23 (2.9295-4.2034)
Dell Pro 13 Premium PA13250; Cyberpunk 2077 FHD ultra no FSR (external Monitor): Ø38 (33.169-47.648)

Akkulaufzeit

Dank des niedrigen Verbrauchs sind die Akkulaufzeiten ausgezeichnet, wir messen annähernd 24 Stunden im Wi-Fi- und Videotest, ein Spitzenwert! Dabei liegt der 60-W-Akku kapazitätstechnisch eher im Mittelfeld. Das XPS 13 verliert durch seinen leicht kleineren Akku (55 Wh) nur knapp.

Akkulaufzeit
WiFi Websurfing
24h 00min
Big Buck Bunny H.264 1080p
23h 45min
Last (volle Helligkeit)
2h 50min
Dell Pro 13 Premium PA13250
Core Ultra 7 268V, Arc 140V, 60 Wh
MSI Prestige 13 AI Plus Evo A2VMG
Core Ultra 7 258V, Arc 140V, 75 Wh
Lenovo ThinkPad X13 2-in-1 Gen 5
Ultra 7 165U, Graphics 4-Core, 54.7 Wh
Framework Laptop 13.5 Core Ultra 7 155H
Ultra 7 155H, Arc 8-Core, 61 Wh
Dell XPS 13 9350
Core Ultra 7 256V, Arc 140V, 55 Wh
Microsoft Surface Pro Copilot+
SD X Plus X1P-64-100, Adreno X1-85 3.8 TFLOPS, 47 Wh
Durchschnitt der Klasse Subnotebook
 
Akkulaufzeit
-44%
-50%
-52%
-15%
-48%
-36%
H.264
1425
731
-49%
841
-41%
WLAN
1440
804
-44%
739
-49%
630
-56%
1236
-14%
662
-54%
Last
170
84
-51%
90
-47%
142
-16%
89
-48%
Idle
2296
3407

Notebookcheck Gesamtbewertung

Das Dell Pro 13 Premium ist beinahe alles, was man von einem mobilen Business-Laptop erwartet: Es ist recht klein, leicht, sparsam, hat eine tolle Akkulaufzeit und trotzdem eine hohe Leistung. Echte Kritikpunkte gibt es, abgesehen vom hohen Preis, quasi nicht.

Dell Pro 13 Premium PA13250 - 05.05.2025 v8
Christian Hintze

Gehäuse
90 / 98 → 92%
Tastatur
94%
Pointing Device
94%
Konnektivität
70 / 74 → 94%
Gewicht
73 / 20-77 → 94%
Akkulaufzeit
93%
Display
86%
Leistung Spiele
56 / 75 → 75%
Leistung Anwendungen
79 / 92 → 86%
AI Performance
86%
Temperatur
95%
Lautstärke
86%
Audio
79 / 91 → 86%
Kamera
51 / 75 → 68%
Durchschnitt
72%
90%
Subnotebook - gewichteter Durchschnitt
Weitere Informationen über unsere Bewertung finden Sie hier.
CO2 Emissions
No Data
Materials
85%
Packaging
95%
Power Use
89.7%
Repairability
38%
Software Updates
22.3%
Recycle Logo Total Sustainability Score: 55%

Transparenz

Die Auswahl der zu testenden Geräte erfolgt innerhalb der Redaktion. Das vorliegende Testmuster wurde dem Autor vom Hersteller oder einem Shop zu Testzwecken leihweise zur Verfügung gestellt. Eine Einflussnahme des Leihstellers auf den Testbericht gab es nicht, der Hersteller erhielt keine Version des Reviews vor der Veröffentlichung. Es bestand keine Verpflichtung zur Publikation. Unsere Reviews erfolgen stets ohne Gegenleistung oder Kompensationen. Als eigenständiges, unabhängiges Unternehmen unterliegt Notebookcheck keiner Diktion von Herstellern, Shops und Verlagen.

So testet Notebookcheck

Pro Jahr werden von Notebookcheck hunderte Laptops und Smartphones unabhängig in von uns standardisierten technischen Verfahren getestet, um eine Vergleichbarkeit aller Testergebnisse zu gewährleisten. Seit rund 20 Jahren entwickeln wir diese Testmethoden kontinuierlich weiter und setzen damit Branchenstandards. In unseren Testlaboren kommt ausschließlich hochwertiges Messequipment in die Hände erfahrener Techniker und Redakteure. Die Tests unterliegen einer mehrstufigen Kontrolle. Unsere komplexe Gesamtbewertung basiert auf hunderten fundierten Messergebnissen und Benchmarks, womit Ihnen Objektivität garantiert ist. Weitere Informationen zu unseren Testmethoden gibt es hier.

Alle 9 Beträge lesen / Antworten
static version load dynamic
Loading Comments
Diesen Artikel kommentieren / Antworten
Teilen Sie diesen Artikel, um uns zu unterstützen. Jeder Link hilft!
Mail Logo
> Notebook Test, Laptop Test und News > Tests > Notebook Testberichte > Test Dell Pro 13 Premium: Der fast perfekte Business-Laptop
Autor: Christian Hintze, 21.03.2025 (Update:  5.05.2025)

OSZAR »